
April EI Numbers Bleak
So Erin talked about falling EI benefits last month, which got me thinking about the longer term trend here.
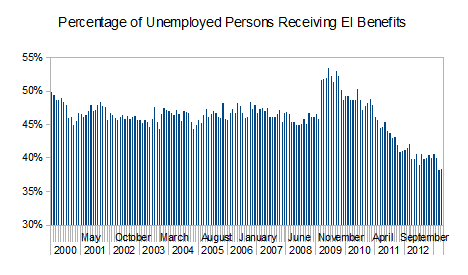
Comparing seasonally unadjusted data for the last five Aprils, we see a steady decline in the proportion of unemployed workers that are receiving EI. Â Since April 2009, unemployment in Canada has fallen by nearly 150,000, which is about a 10% decline in unemployment. Â The number of workers covered by EI has fallen from 866,000 to 566,000 – a decline of over one-third. That’s why we see a fall in coverage from 56% in April 2009 to 40% in April 2013.
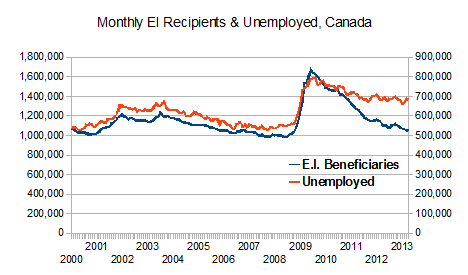
The graph above shows the seasonally adjusted trends in monthly unemployment and EI recipients from January 2000 to April 2013. (Unemployment shown on the left axis, EI recipients on the right axis). Â There is a marked increase in EI recipients at the onset of the ’08-’09 recession, when significant stimulus was delivered through the EI program. Â As that stimulus was removed, the number of EI recipients dropped, much faster than the number of unemployed workers. Which is why we get the cliff-like drop in EI coverage shown in the graph below, also showing January 2000 – Â April 2013.
We don’t stress enough that part of the problem here is the duration of benefits.  According to the 2012 EI Monitoring and Assessment report (chart 28), in 2010 / 2011 nearly 30% of regular EI recipients exhausted their benefits, up 5 percentage points from 2009 / 2010. Given that the Extended Employment Insurance Benefits Pilot Project was phased out in September 2012, and the increase in temporary work, this number will likely continue to be significant.