The Temporary Recovery
Forget total employment numbers, it’s the types of jobs coming back that count.
There is a shadow side to this recovery that may undo it in the end. Uncertainty is fast becoming the new normal in the labour market, and that has long-term implications for aggregate demand, household indebtedness, and the rate of defaults on mortgages and credit cards.
The latest Labour Force Survey results show that — though there are still 253,000 fewer jobs than when the recession began in October 2008 — employment growth continues its slow path upward. As Erin Weir noted on Friday, this month’s rising head count is driven by part-time jobs.
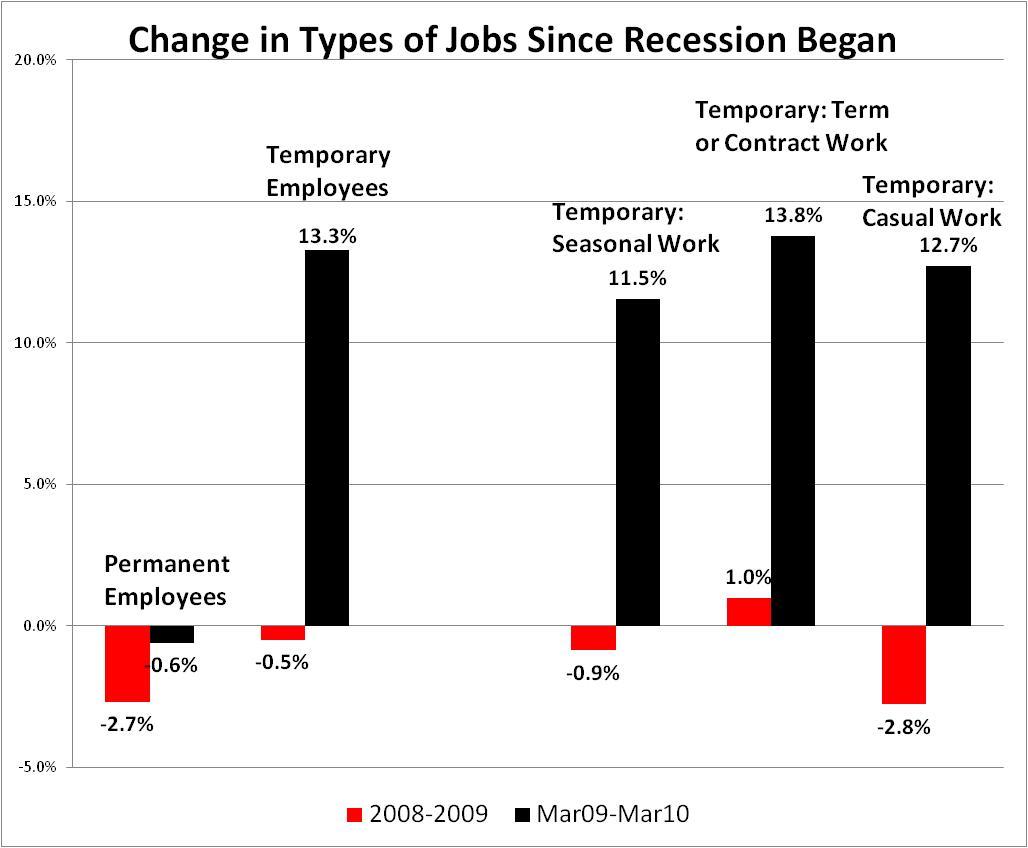
By March 2010 there were 47,800 more part-time jobs than when the recession began, but we are still down 300,000 full-time jobs. That mirrors another shift from stable to unstable jobs: more temporary jobs, fewer permanent ones.

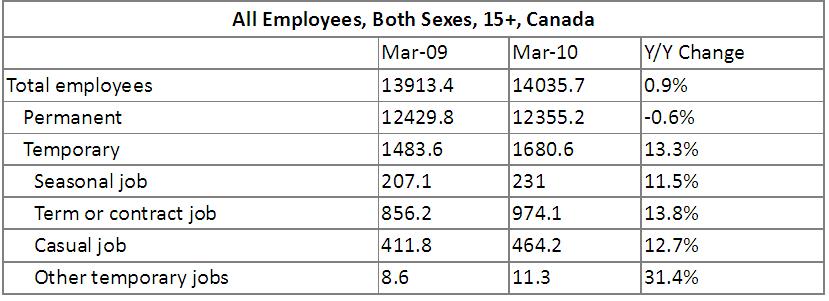
(The latest data on temporary, permanent and self-employed work are not published on-line by Statistics Canada, and must be purchased. Since these data are not supplied on a seasonally adjusted basis, the analysis is year over year.)
March 2009 was near the trough of the recession, though job losses continued until July 2009. The most recent data show a continuing loss of permanent jobs despite recovery, and accelerating growth in temporary jobs.
The hemorrhaging of permanent jobs has slowed since the depths of the recession, but not stopped: the pool of permanent jobs continues to shrink.
In contrast, the fastest growth in new job opportunities is through term or contract positions (almost 120,000 more such jobs over the past year, led by the health care, manufacturing and business/building support sectors) , and seasonal work ( almost 25,000 more jobs, led by the culture/recreation, trade and manufacturing sectors).

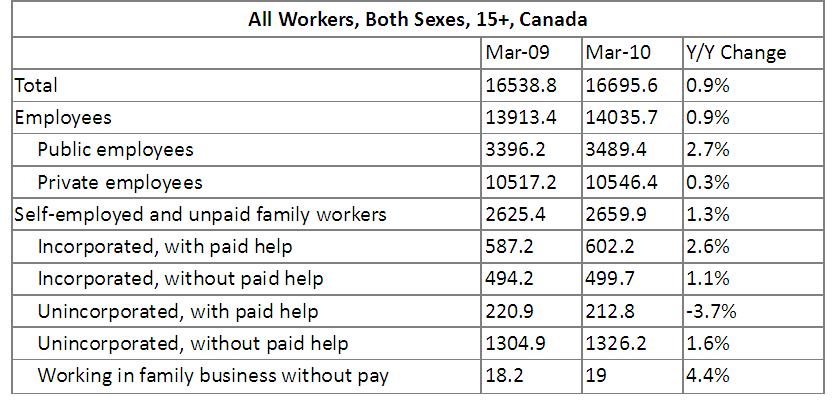
There were 120,000 more employees in March 2010 than in March 2009, but with about 14 million people on payroll, that represented a less-than-1% increase.
The public sector was the primary source of new employment, adding another 93,000 employees over the past year. In the coming months, the number of public sector jobs may decline, as deficit-harried governments look for cost-savings through cuts or attrition.
Let’s hope the private sector picks up the pace in job creation soon. Over the past year, private sector employers added only 23,000 jobs (essentially no net growth), though that apparent stability masks the changing mix of permanent and temporary jobs described above.

Over the past year, as recession turned to recovery, the self-employed created more jobs than the private sector. An additional 34,500 hopefuls have put up their shingle, with the biggest growth among the loners – unincorporated without paid help. That increase is being driven by older workers. As of March 2010, there were 53,000 more people aged 55 and older who were self-employed than a year before, meaning younger people who had tried their luck at self-employment earlier in the cycle gave up. There were 30,000 fewer self-employed people aged 25 to 54 in March 2010 than a year before, and all but 3,000 or so of them were aged 25 to 45, so this isn’t just an artifact of demographics.
Over the past year, the increase in self-employment was led by professional, scientific and technical services; finance, insurance and real estate services; and information, culture and recreational services.
The job numbers for March were partly fuelled by the Olympics and government stimulus projects. When these one-time shots in the arm are gone, what kinds of jobs will emerge to fuel a sustainable recovery based on stable, balanced household budgets? It’s hard to see how you can build durable prosperity on a foundation of so much uncertainty.
Last week Mel Watkins posted a piece reminding us there is debate about the primary purpose of Keynesianism: was it primarily about managing uncertainty or managing demand? What is uncontested is that the Keynesian policy thrust from the mid 1940s to the early 1970s reduced uncertainty and increased economic security.
After a brief, panic-induced flirtation with Keynesianism in the depths of the financial crisis, we are slipping back towards the “less government, more market†nostrum that has dominated our lives for the past three decades.
The global economic meltdown may have repudiated this approach for a time, but our policy makers are back to their hands-off-the-wheel stance as stock markets, GDP and corporate profits rebound.
The trouble is, recovery of these macro indicators is meaningless if they don’t lead to the type of recovery that generates good jobs – and soon.
The current shift towards increasingly temporary and impermanent employment injects a new uncertainty into the macro environment. Without lasting jobs at decent incomes, it won’t take much to topple the whole house of cards once more.

great post Armine.
I just wanted to add that I have been doing a bit of research on public sector employment and if one adds fed, prov, and municipal workers up (essentially NAICS 91) and divide by the average total employment say from 1987, we actually have a substantial decrease in public sector workers as a percentage of total employment from 6.3% to 5.5%. And it is a mainly a downward sloping line.
Of course this does not include education and health care, if you do include those, we have a small increase from 21.4% in 1987 to 24.2 % in 2009. And this increase is mainly in healthcare as the baby boom demographics have dramatically increased demand for healthcare services. So I really do not understand this whole burgeoning public sector discourse that has gripped the right and center politicians. It is a myth.
And if one looks at average pay between the two sectors, contrary to what the CFIB has published with their “report”, the average wage between the two sector shows no significant difference. (multiply the LFS numbers out and you will get that result)
Again, I hate to hammer home a point, we desperately need to build a measure for precarious employment and employment quality coming from the LFS, not job quality- but employment quality, a bit of a difference.
I am in discussion this coming week into outlining a plan to design such an index. I’ll keep you posted.
P.S. I still say the self employment numbers are infested with some kind of respondent non-sampling error, i.e. the respondent is denying their unemployment or over estimating the extent of the self- employment they are involved in. We all know that business bankruptcy is the highest for these self employed, without employees- that is if they have even registered their business. I guess one could check into the business register file and see if there has been a huge jump in these types of business registrations, and also look and see if there has been a spike in these bankruptcies. If these respondents are correctly answering these self employment questions, then you should see a spike in registrations an also a spike in bankruptcies displaying these business demographics.
p.s.s not all those healthcare and education NAICS counts are public sector, so 24% is a bit high, but I am sure the growth rate is close to the actual
I suspect what bugs the CFIB is that in the public sector the wages are a bit flatter. The average may be the same, but I bet the median ain’t, because although it’s gradually changing it remains true that the top-level wages in the public sector are far less ridiculous than those in the private sector.
I think I’ve said this before around here, but I’m convinced that we’re in a housing bubble–the Americans’ popped (well, arguably is continuing to deflate), but ours hasn’t. Yet. I really think that in Vancouver, now that the Olympics are over, we’ve got less than a year of speculation before the plug comes out.
At that point the mini-recovery having been led by temporary jobs will probably bite us kind of hard.
Campbell and Hansen have given, banks, large corporations, gas and oil company’s millions of dollars and huge tax deductions to boot. They said the HST would create jobs. Large chain stores and supermarkets, will only give citizens, 20 hours per week, so they don’t have to pay benefits. The HST was created to benefit big businesses only. The housing bubble is in Vancouver, not in the central and the northern parts of the province. The infrastructure jobs will be gone, when the roads are finished, that is only a band aid, for the moment. The budget and the HST will cause thousands of citizens to become homeless. So, the loss of revenue, will increase again. How many more vicious circles can the people of BC survive?