
Job Numbers Surprise
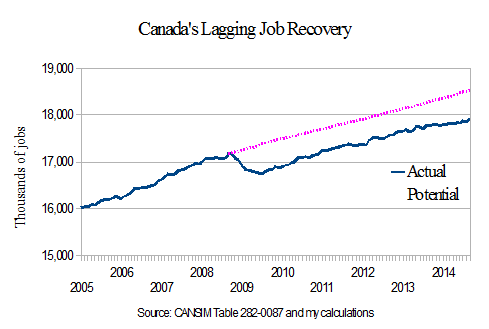
For the first time in a while, Statistics Canada gives us some good news on the job front. 74,000 net new jobs added in September, certainly nothing to sneeze at. Still, we would need to keep this pace up every month for the next year to close the employment gap left by the last recession.
On the graph below, this month’s huge uptick barely makes a dent. The blue line is how many jobs we have, and the dotted pink line is how many we would have if the employment rate were 63.6%.
This holds true for workers age 15-64 as well, but in terms of total employment is a bigger issue for men (it is still a he-cession). The potential job growth lines (shown as dotted lines on the graph), are based on pre-recession employment rates. A year and a half ago, women were very close to their potential employment rate, but the trend has fallen off a bit since then.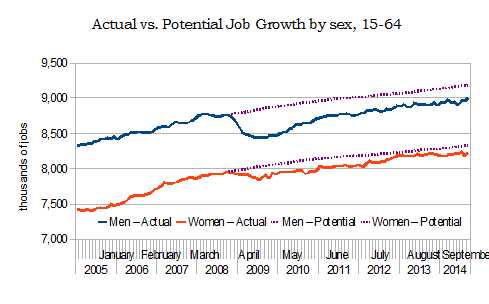
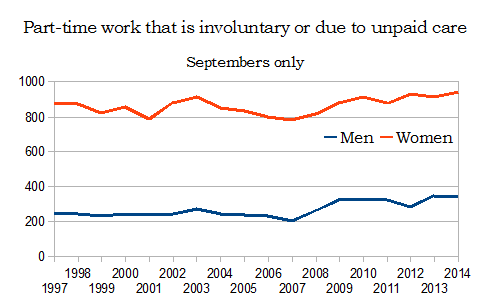
More women work part-time than men, for various reasons, but it’s often to accommodate unpaid care work or because they can’t find full-time work. The number of men and women working part-time involuntarily is higher this September than it’s been in a month of September since 1997.
And for young workers who are new to Canada, there has been no recovery. Â In the chart below I compare actual and potential employment for the months of September since 2006. To graph potential I use both the Canadian born young worker employment rate, and the new Canadian young worker employment rate.
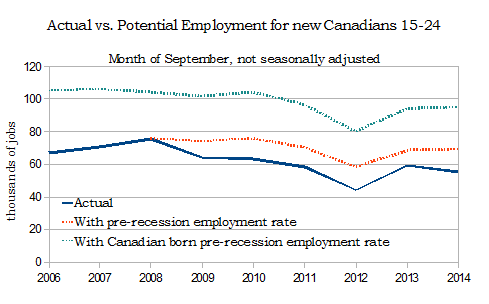
Overall, recent immigrants have seen fewer jobs return. The unemployment rate for recent immigrants (less than 5 years) stood at 13.7%, compared to 6.5% for Canadian born workers. We don’t just need to create jobs, we need to create good jobs, and they need to be available to everyone.
Angella, I think you may need to revisit the employment rates for men and women. If you are going to extend out the trends in such a manner- which is highly arbitrary I guess- one may want to go back a few more years like I did in this article and compare employment rates.
http://www.livingwork.ca/?p=75
I actually feel if you use the timelines that I do- you come to very different conclusion of He-cession versus she-cession. In fact the significant point to be raised- as I argue in my article- have we reached the high point of women’s participation as it is the first time in 30 years we have witnessed an extended flattening. Something I think we all need to start working on more is the timelines for these labour market indicators- there are short term, medium term and longer term trends as well as post recession activity which I think fits into the medium term trend.
Something I am going to try and establish in some upcoming work- which trends really matter- which trends have we seen something dramatic in terms of change, and those which we need to focus on. It is an interesting aspect of studying labour market dynamics. However the one that gets all the focus and is truly the wrong one to focus on given the sample sizes and natural variances and the massive seasonality adjustments that are used- is the monthly changes. Such an inefficient use of collective ration thought that gets hijacked by statistical laws and small samples. However the media focuses on it, but it does not mean we have to make such meaningless analysis- sometimes the longer terms and medium term is actually a focal point – which is good. However, in this age of information and policy, I would hope we could start using measures- such as moving 3 month averages, and other more meaningful data to educate the public. We need to serve this up a whole lot better, I was hoping that potentially some labour economists on here could get together and put together a serious debate and potentially some written work on how we need to change the monthly analysis of our labour market data- which measures are important- what times frames bring us a better picture less influenced by the sampling and non-sampling variance- etc. I do think it is time for us to set up some new standards and push the boundaries on the reality of labour market information- rather than this constant back and forth of this meaningless back and forth between the left and right wing labour market analysts that goes on every month. I know the politicians want to score political points each month- but does anybody really pay attention to this monthly stuff anymore??? And given the variances- is there really any point to the whole thing- why not do something new and more exciting- and meaningful. I am not pointing at you but everybody within this space- it is time we started elevating our analysis to something that has meaning- monthly analysis just has no real meaning unless one starts mentioning statistical measures and trends that have some basis of reality mixed into them. Discussing random fluctations month after month does get tiring. They are several ideas I have to transform this and still achieve the purposes of making monthly political points but at least have them legitimately based in a scientific realm of acceptance. We can do this.
Paul, thank you for your comments. I am equally frustrated with the monthly back and forth, which is why I am trying to focus more on medium term trends. I also intended the involuntary part time to point to structural issues in women’s labour force participation (childcare!), and the two “potential” lines for recent immigrant young workers to point to structural barriers for them. As much as the cyclical variation has been in men’s work, there are other structural issues that I am concerned about.
Again, I would love to take part in the conversation that you describe!
Sorry Angella, I am not specifically pointing at you as I do appreciate the need to monthly make statements and you have done a great job mixing the monthly with the other time intervals. There is something worrisome I am finding with the drop in women’s participation rates- nobody has nailed it down yet but for the first time in 30 years we are seeing a flattening to a once very strong and consistent trend. I do wonder what will happen to many industries attached to women entering the workforce in a constant acceleration that has no flat lined. Is it child care? Will the trend pick up- it seems like men have again adjusted to a bit lower of a employment rate similar to most other recessions over the past 30 years. And this is for prime age men and women!
I wonder how we can initiate this into a wider formal discussion- I will follow up with some others in the zone and see what we can come up with. I do think there are some very critical parameters and time lines that could become a bit more of a focused set of analytical outputs in a month to month fashion. I also understand that there are most like a dozen or so measures or rations that can become talking points each month. It maybe a good starting point in identifying these key measures and the time frames that make sense – this given the trends, variances and subject matter issues surrounding their measurement and definition.
If we can do that then potentially we can set up a measurement site somewhere to collectively keep tabs on them and open up a forum for discussion on several of these. It could be a very cool labour market wonk way to collect deeper thoughts and ideas on many of these measures and also educate many people with interest. We could also set up some software to allow those inclined to make some projections for trends- I am sure the media would have a feeding frenzy on that one. Recall if you serve them the food they like- they will indeed most likely eat it.
I wanted to do this myself but I think it is something an organization like the CCPA or somebody should be doing- somebody that the media feels they can digest food from more easily and not fear they are being poisoned?
The tech is here- the brains are here- we just need set up the process and lay down a bit of form to.
In recent years I’ve heard of a trend towards families deciding to have the mother, or even the father, stay at home to take care of thier children, even if it means sacraficing some income. This could help explain the why the women’s employment rate has stopped increasing.