
More on alternate measures of unemployment
I’ve mentioned differences between Statistics Canada’s R8 measure and the U.S. Bureau of Labour Statistics’ U6 measure before, but I think it’s worth covering again.
R8 is Canada’s broadest measure of unemployment, and includes discouraged workers, workers waiting for a job to begin, and a portion of involuntary part-time. The most recent value for R8 was 10.3% in August, down slightly from 10.5% in August 2012 and 2011.
U6 is the U.S. Bureau’s broad measure of unemployment, and includes all workers who would like a job but aren’t looking, for any reason, and all involuntary part-time workers.
Statistics Canada leaves out some marginally attached workers that BLS includes. They also calculate involuntary part-time in full-time equivalents (FTE), even though neither employment or unemployment are measured in FTE. And, for R8, Statistics Canada only includes a portion of involuntary part time.
Aside from making R8 more restrictive than U6, this also makes it harder to replicate. U6 is very easy to calculate from other data that Statistics Canada provides.
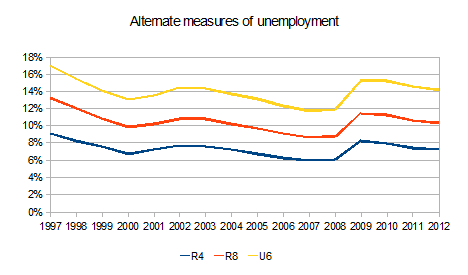
All three measures follow the same broad trend over the past 16 years, but there are some small differences. The gap between R4 and R8 is still higher than it was before the recession, but sits pretty close to its average since 1997. The gap between R4 and U6 sits at 7 percentage points, slightly higher than its 16 year average of 6.5 percentage points.
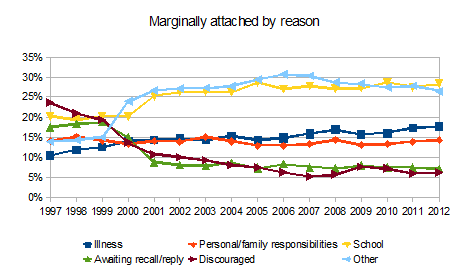
A look at the trends in the types of marginally attached people that get counted or not counted in R8 add some additional insight. The two types of marginally attached categories that are counted in R8 have fallen from nearly half of all marginally attached workers down to only 15%. Over the same period ‘school’ and ‘other’ have gone from 35% Â to 55% of the total.
Aside from fun with numbers, what’s the point here exactly?
Well, unemployment is higher than it was pre-recession by any measure. Â And when we’re talking about ratios of job vacancies to unemployment, it’s important to remind interested readers that ratio is much higher using broader measures of unemployment. For every job vacancy in Canada this summer, there were 6.3 people actively looking for a job and another 6.7 who wanted more work.
This matters for policy. Case in point is EI, where coverage has fallen to another all time low. The number of people receiving EI is nearing 2008 levels, but the number of unemployed remains significantly higher.
Given the frequency with which the current government and its allies go on about all those “jobs without people”, I think a regular examination of all the people without jobs is in order.
For a more thorough analysis of Canadian and American trends of labour underutilization, see Sam Boshra’s post at Economic Justice: http://economicjustice.ca/2013/07/05/june-2013-lfs-comparing-the-canadian-and-u-s-unemployment-and-labour-underutilisation-metrics/