
Ontario Electricity VIII: Now also going backwards on climate
There have been a number of important developments in the Ontario electricity sector since my last update when I summarized my arguments in front of the Standing Committee on General Government of the Legislative Assembly of Ontario against the proposed provincial Conservative legislation, now enacted, that eliminated the provincial Liberal rate-based borrowing scheme to subsidize electricity prices and replaced it with subsidies from Government revenues. The tax-payer financed subsidy of $2.8 billion in 2018/19 has now ballooned to $6.5 billion in 2021/22 and will continue to increase. This amounts to 0.7% GDP, and is now larger than Long Term Care (LTC) public financing in the Province. Ontario is the only jurisdiction in North America where the Government directly subsidizes electricity prices – indeed, I have a standing public “challenge” for anyone to refute my contention that Ontario’s current in-budget end-user price subsidies are the largest on a GDP basis of any high-income jurisdiction in the world.
But let us set aside that financial disaster for now…. In this post I want to focus on climate, and specifically on greenhouse gas (GHG) emissions and carbon-pricing schemes (carbon “tax” or “taxes” for short). Despite grave governance errors and poor policy implementation that resulted in Canada’s highest electricity systems costs, one very significant Ontario achievement was that in a short decade it was able to wean itself off coal generation and reduce sector GHG emissions by more than 90%. However, as a result of a series of recent operational and policy decisions, Ontario is in danger of losing some of these hard fought gains.
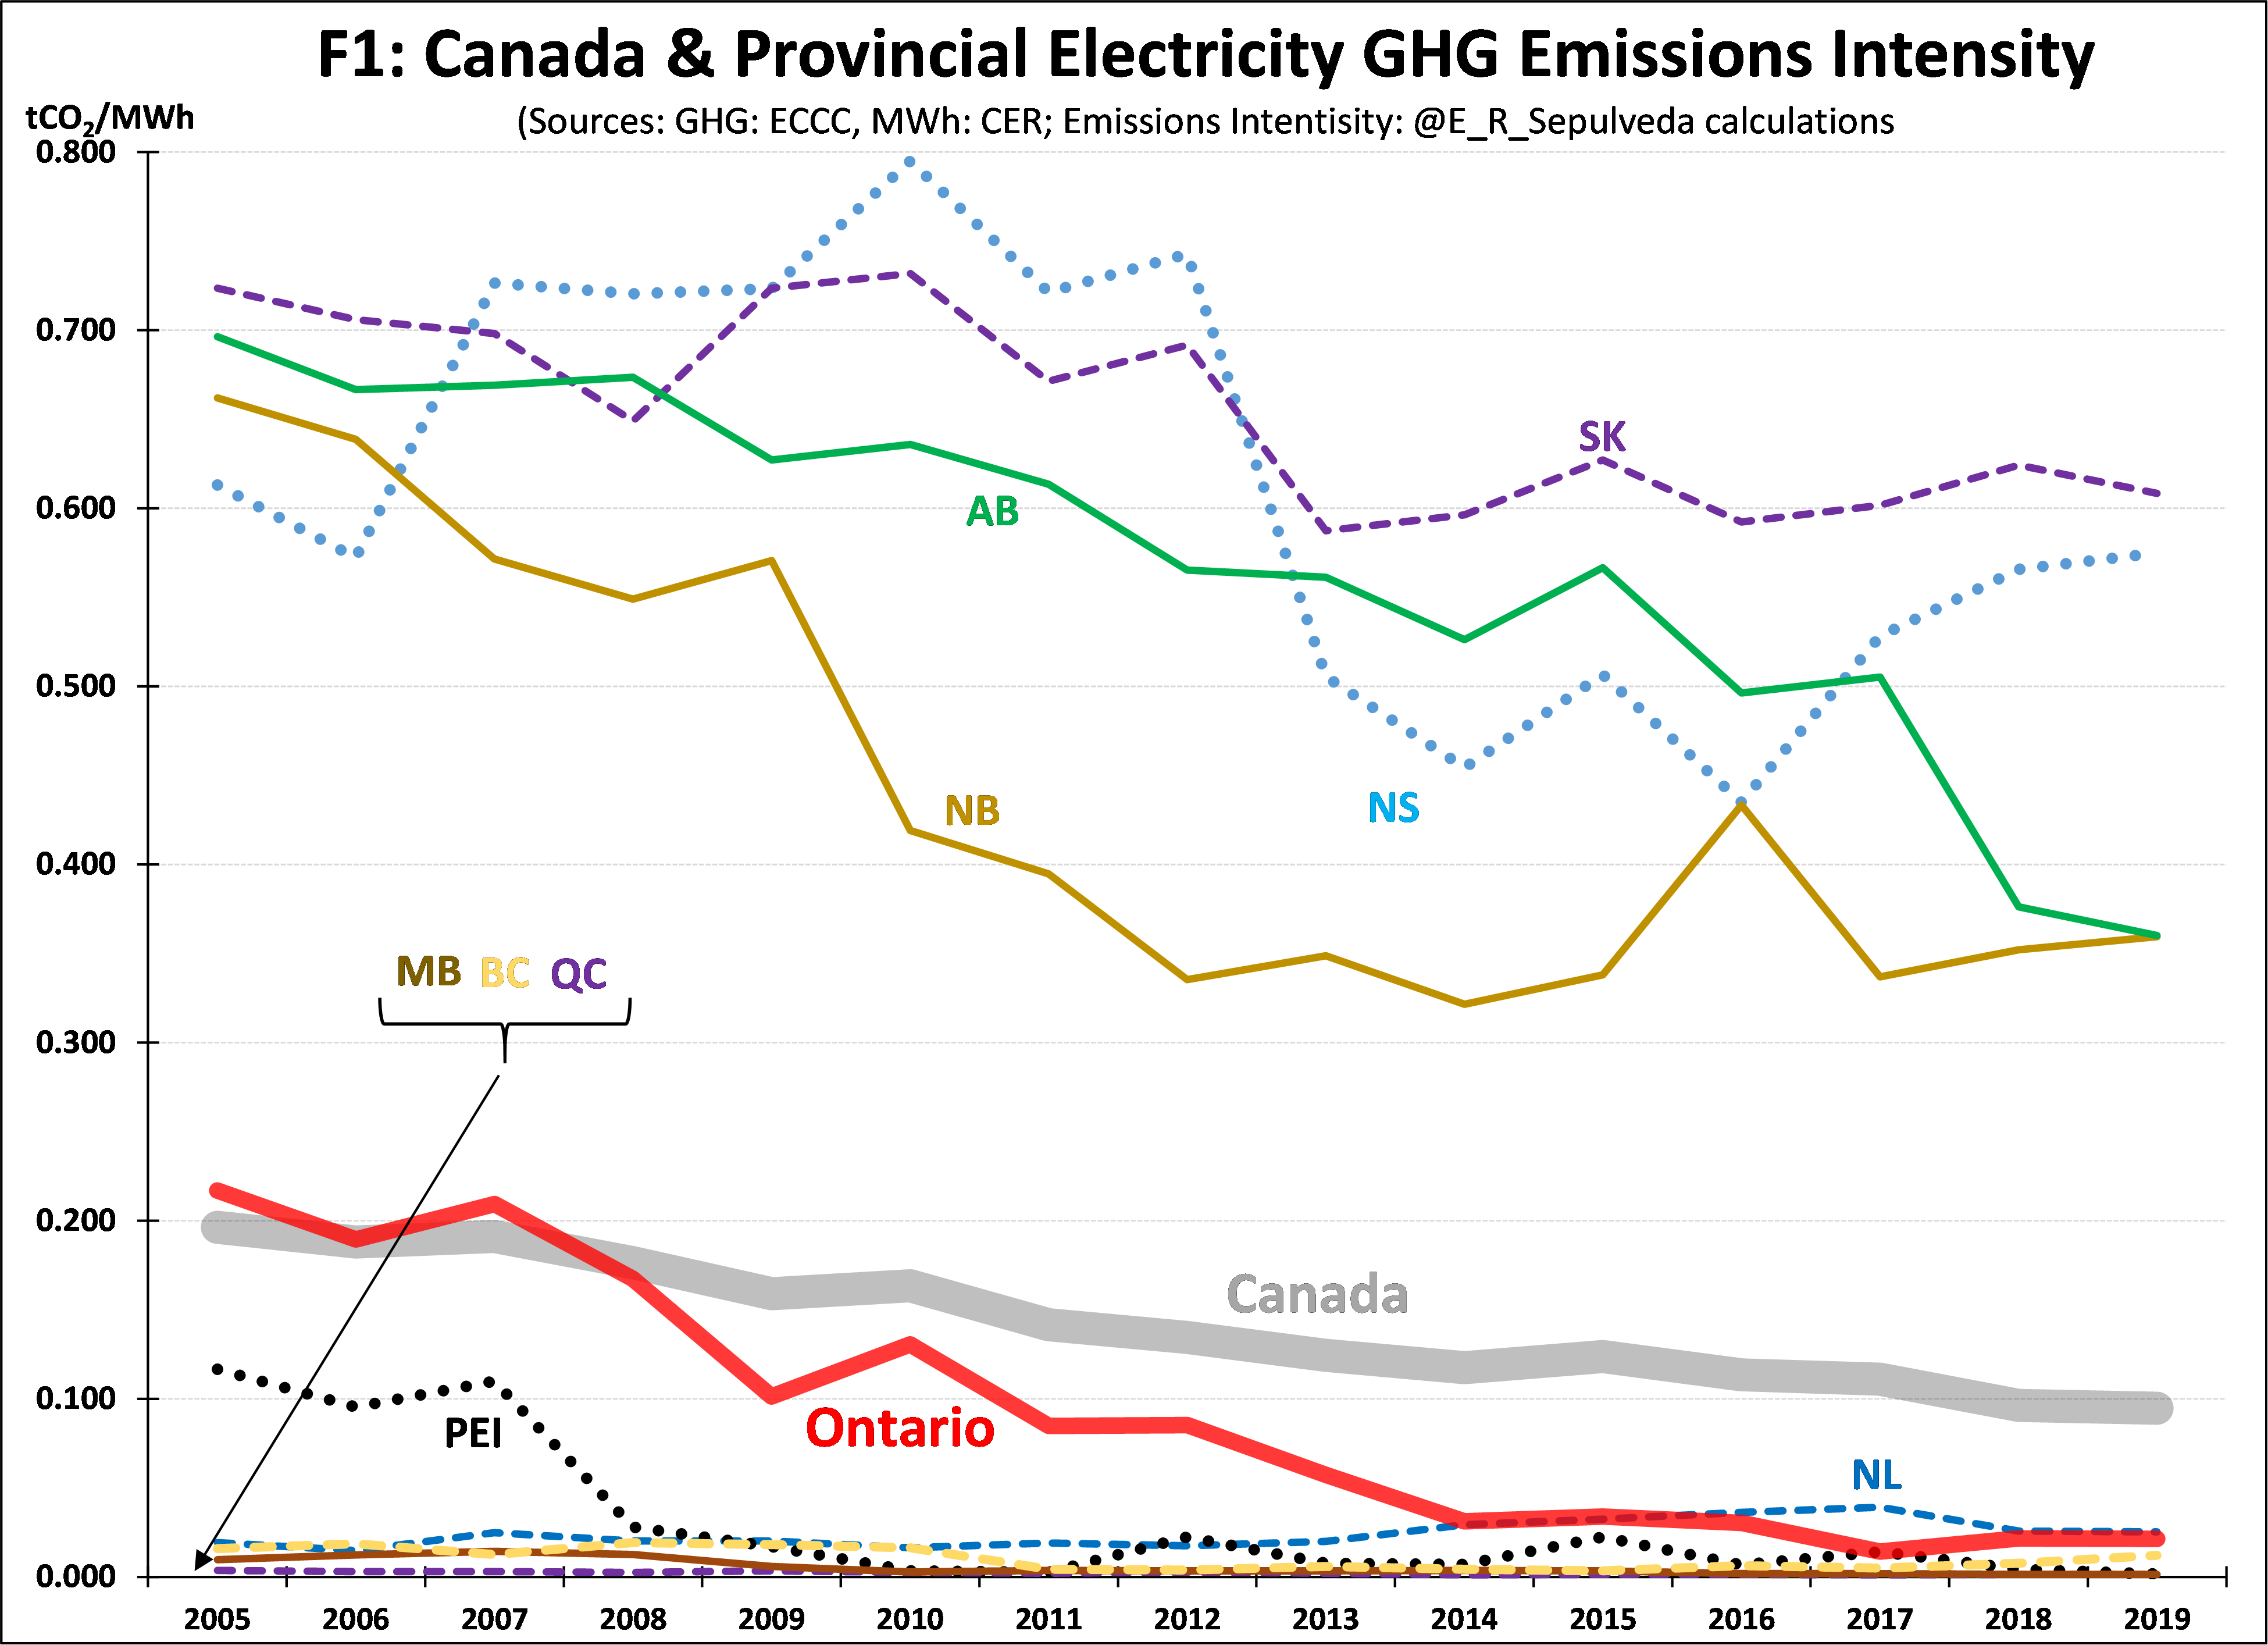
The relative and absolute success of Ontario’s achievement to eliminate coal from the electricity grid is evident from Figure 1, which shows GHG emissions intensity of the 10 provincial electricity grids and of Canada as a whole from 2005 to 2019. In 2005 Ontario was at the Canadian average intensity of around 0.200 tCO2/MWh, but after a 90% reduction by 2019, Ontario is now one of six very low emission provinces, along with PEI, Newfoundland, Quebec, Manitoba and BC. On the other side of the ledger are New Brunswick, Nova Scotia, Saskatchewan and Alberta, all of which still have significant coal, coke and oil generation (combined ratios of 18%, 52%, 30% and 42% for 2019, respectively for each of these four high-emission provinces).
Gas Electricity Generation
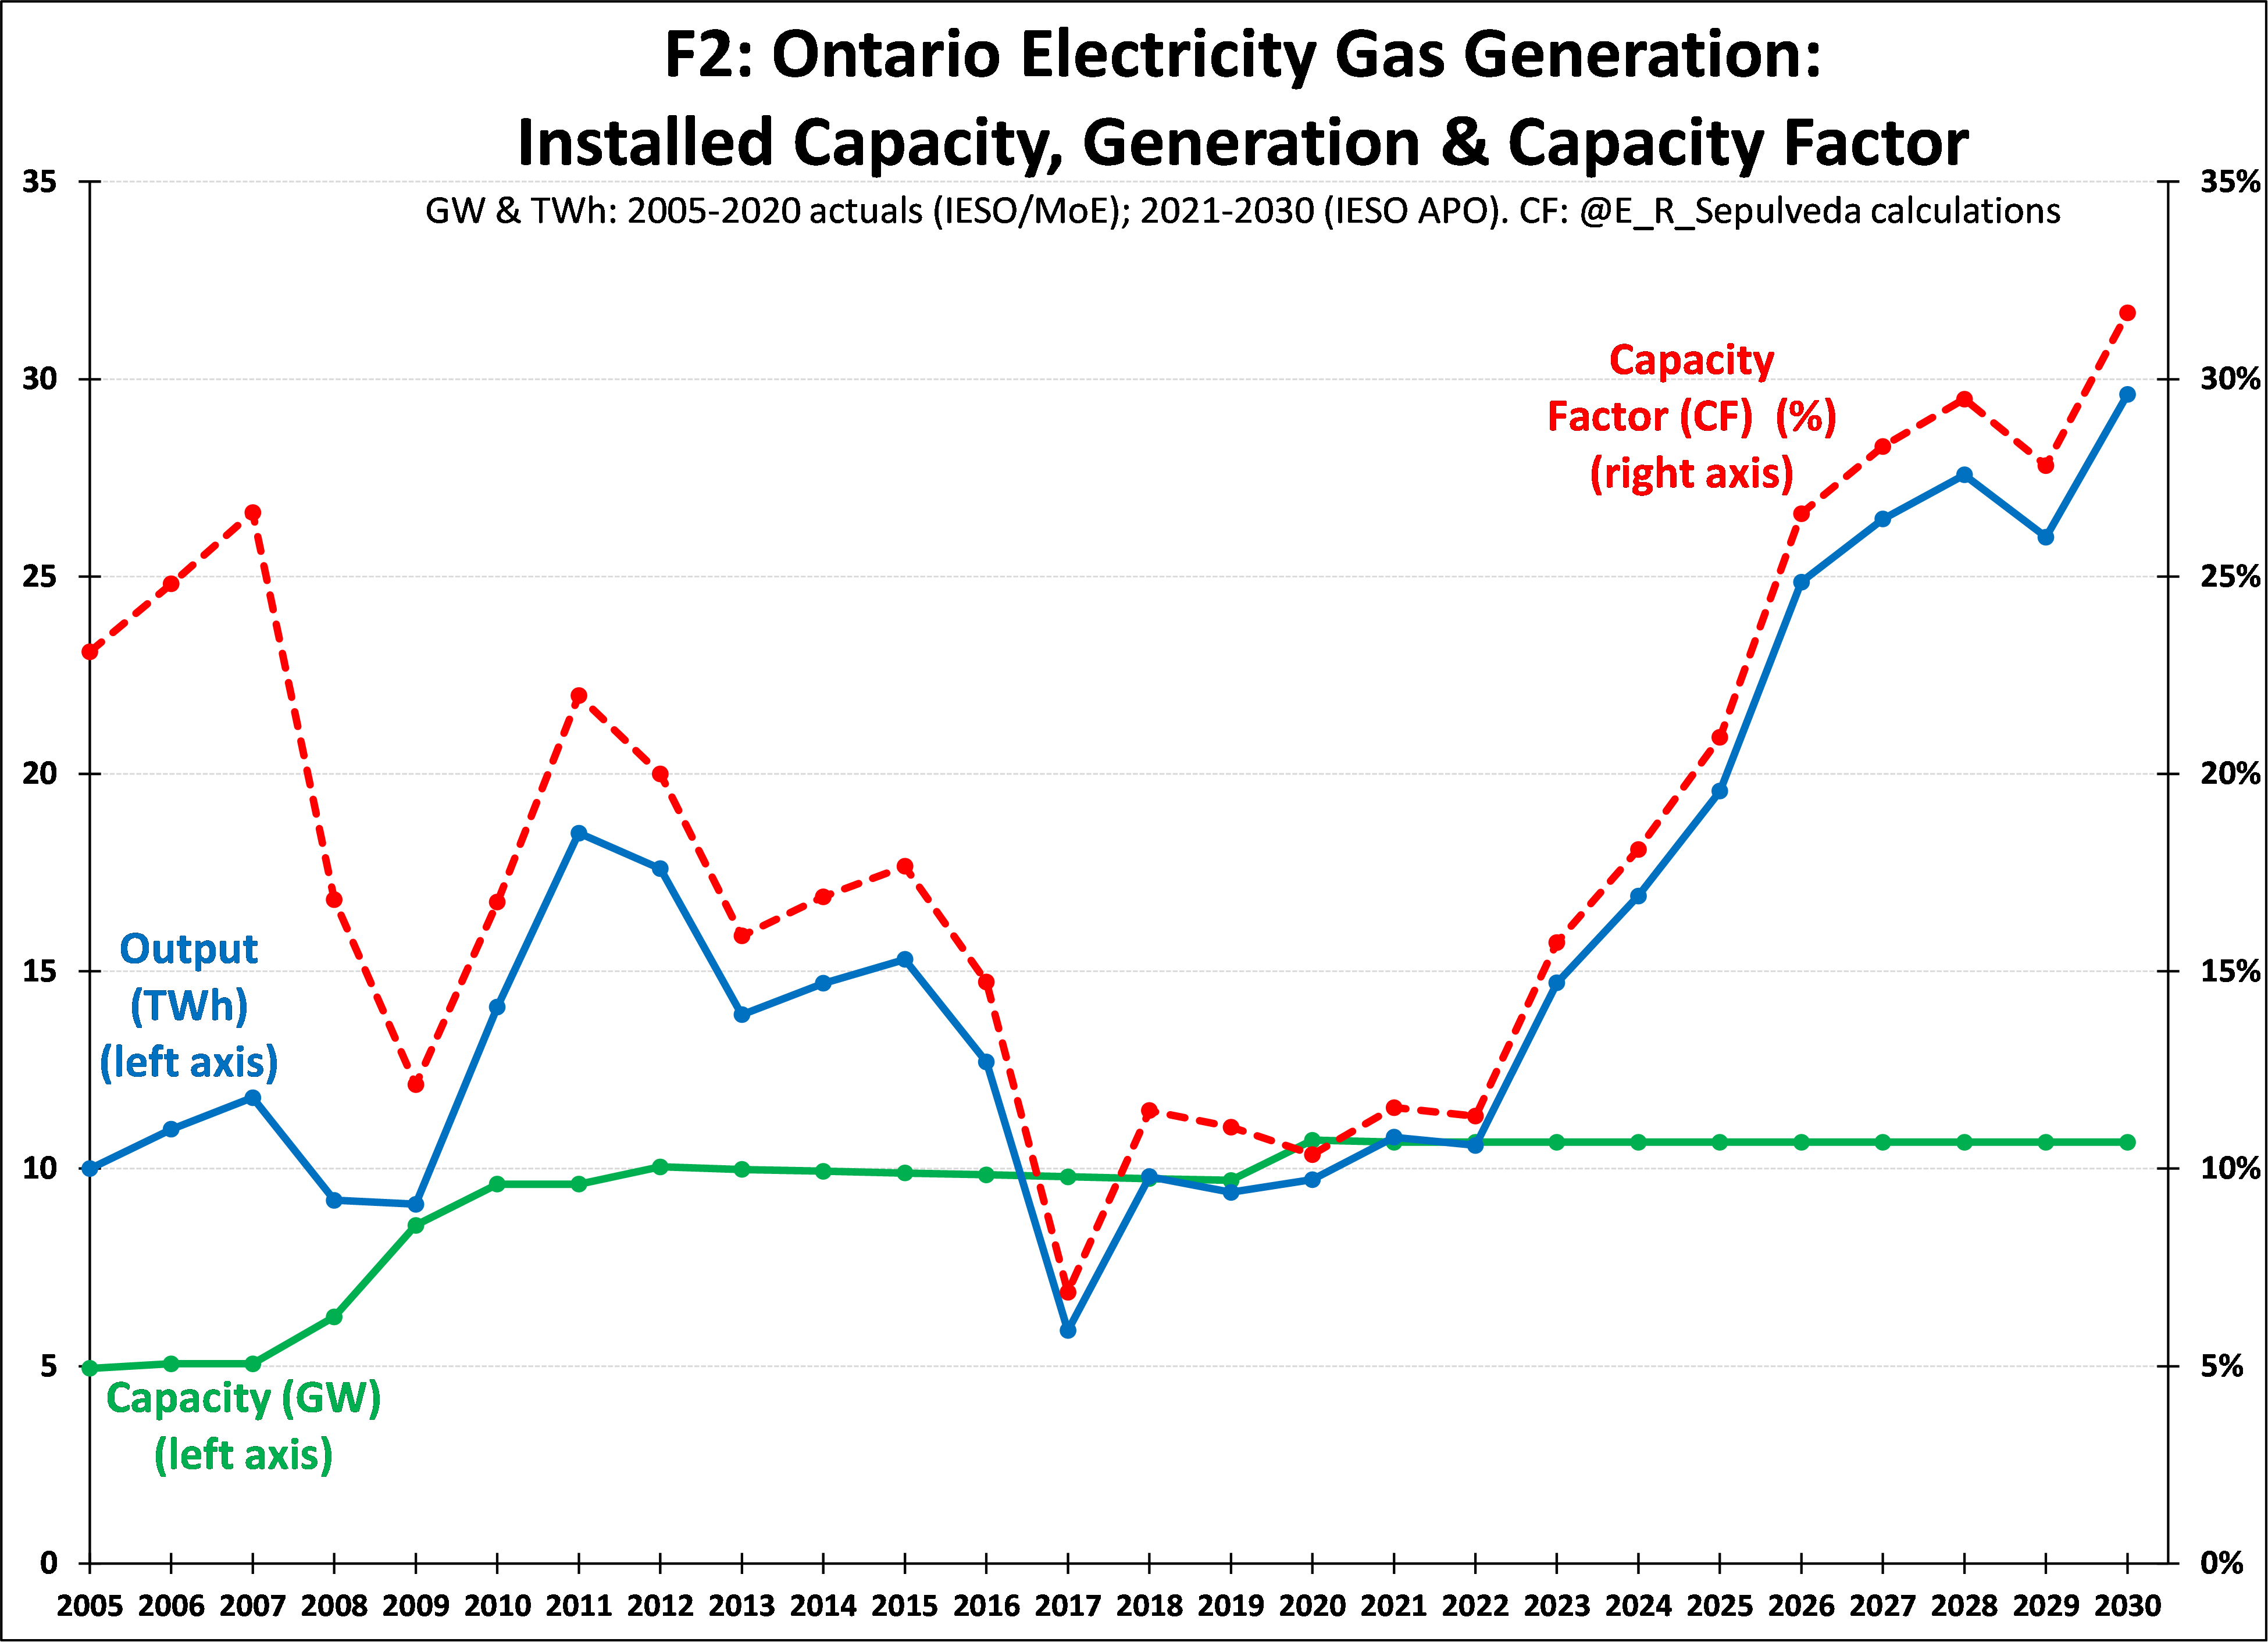
Now that coal generation has been eliminated in Ontario, the only GHG emitting source in the electricity sector is gas generation. Figure 2 shows gas generation in Ontario from 2005 to 2020, and projections to 2030 based on the average of Scenarios 1 and 2 from Ontario’s Independent Electricity System Operator (IESO) 2020 Annual Planning Outlook (APO).
Figure 2 shows that coming out of the 2002 Ontario electricity crisis, gas capacity was running at around 5 GW. However, based on a series of Ministry of Energy (MoE) directives, the monopoly government procurement agency, the Ontario Power Authority (OPA) – whose functions have been folded into those of IESO – procured additional gas plants so that capacity doubled from 2007 to 2012, to the current range of between 10-11GW. Output doubled as well, but the average capacity factor (the % of actual vs. potential output if the plant was to run 24/365) remained around 20%. With declining output over the last 5 years, the capacity factor has now dipped to 10%.
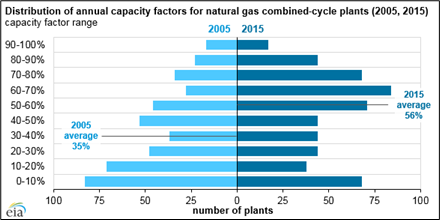
Modern gas plants are designed for, and in most other countries run, at much higher capacity factors. The unnumbered figure below for the USA as a whole shows the distribution and average capacity factors for gas plants for 2005 and 2015 (increasing from 35% to 56%). From a post-facto perspective, it is clear that much, if not most, new MoE-centralized procurement of gas generation in Ontario after 2005 was socially unnecessary. As I have argued in the past, this over-procurement resulted in excess generation capacity in the grid that still has to be paid for and is one of the main drivers of why Ontario has the highest electricity system costs in Canada.
Emissions and Carbon Taxes
Now back to the future… and other acronyms….
Along with creating OPA and IESO, the Conservative sector reforms of 2002 also split up the provincially-owned Ontario Hydro into a generation-only corporation (Ontario Power Generation (OPG)) and a transmission entity, Hydro One (which also retained the distribution networks of rural areas not served by the 70-odd municipally-owned local distribution companies (LDCs)). OPG remains a 100% provincially-owned Crown corporation (Canadian terminology for what is generally referred to as a “state owned enterprise” (SOE), while Hydro One has been 51% privatized.
In 2019 OPG announced that it had decided not refurbish its Pickering Nuclear Generating Station (PNGS) and to shutter it in 2024-25. Ontario will need to replace that 20-23 TWh of output to make sure the lights stay on. Figure 2 shows that IESO projects that nearly all of that “missing output” will be taken up by increasing gas output from current gas plants, increasing gas output from the current 10 to 30 TWh by 2030. This will push Ontario gas capacity factors to a “record” 30% by 2030 – still 5% below what the USA achieved in 2005 and 26% below 2015 levels!
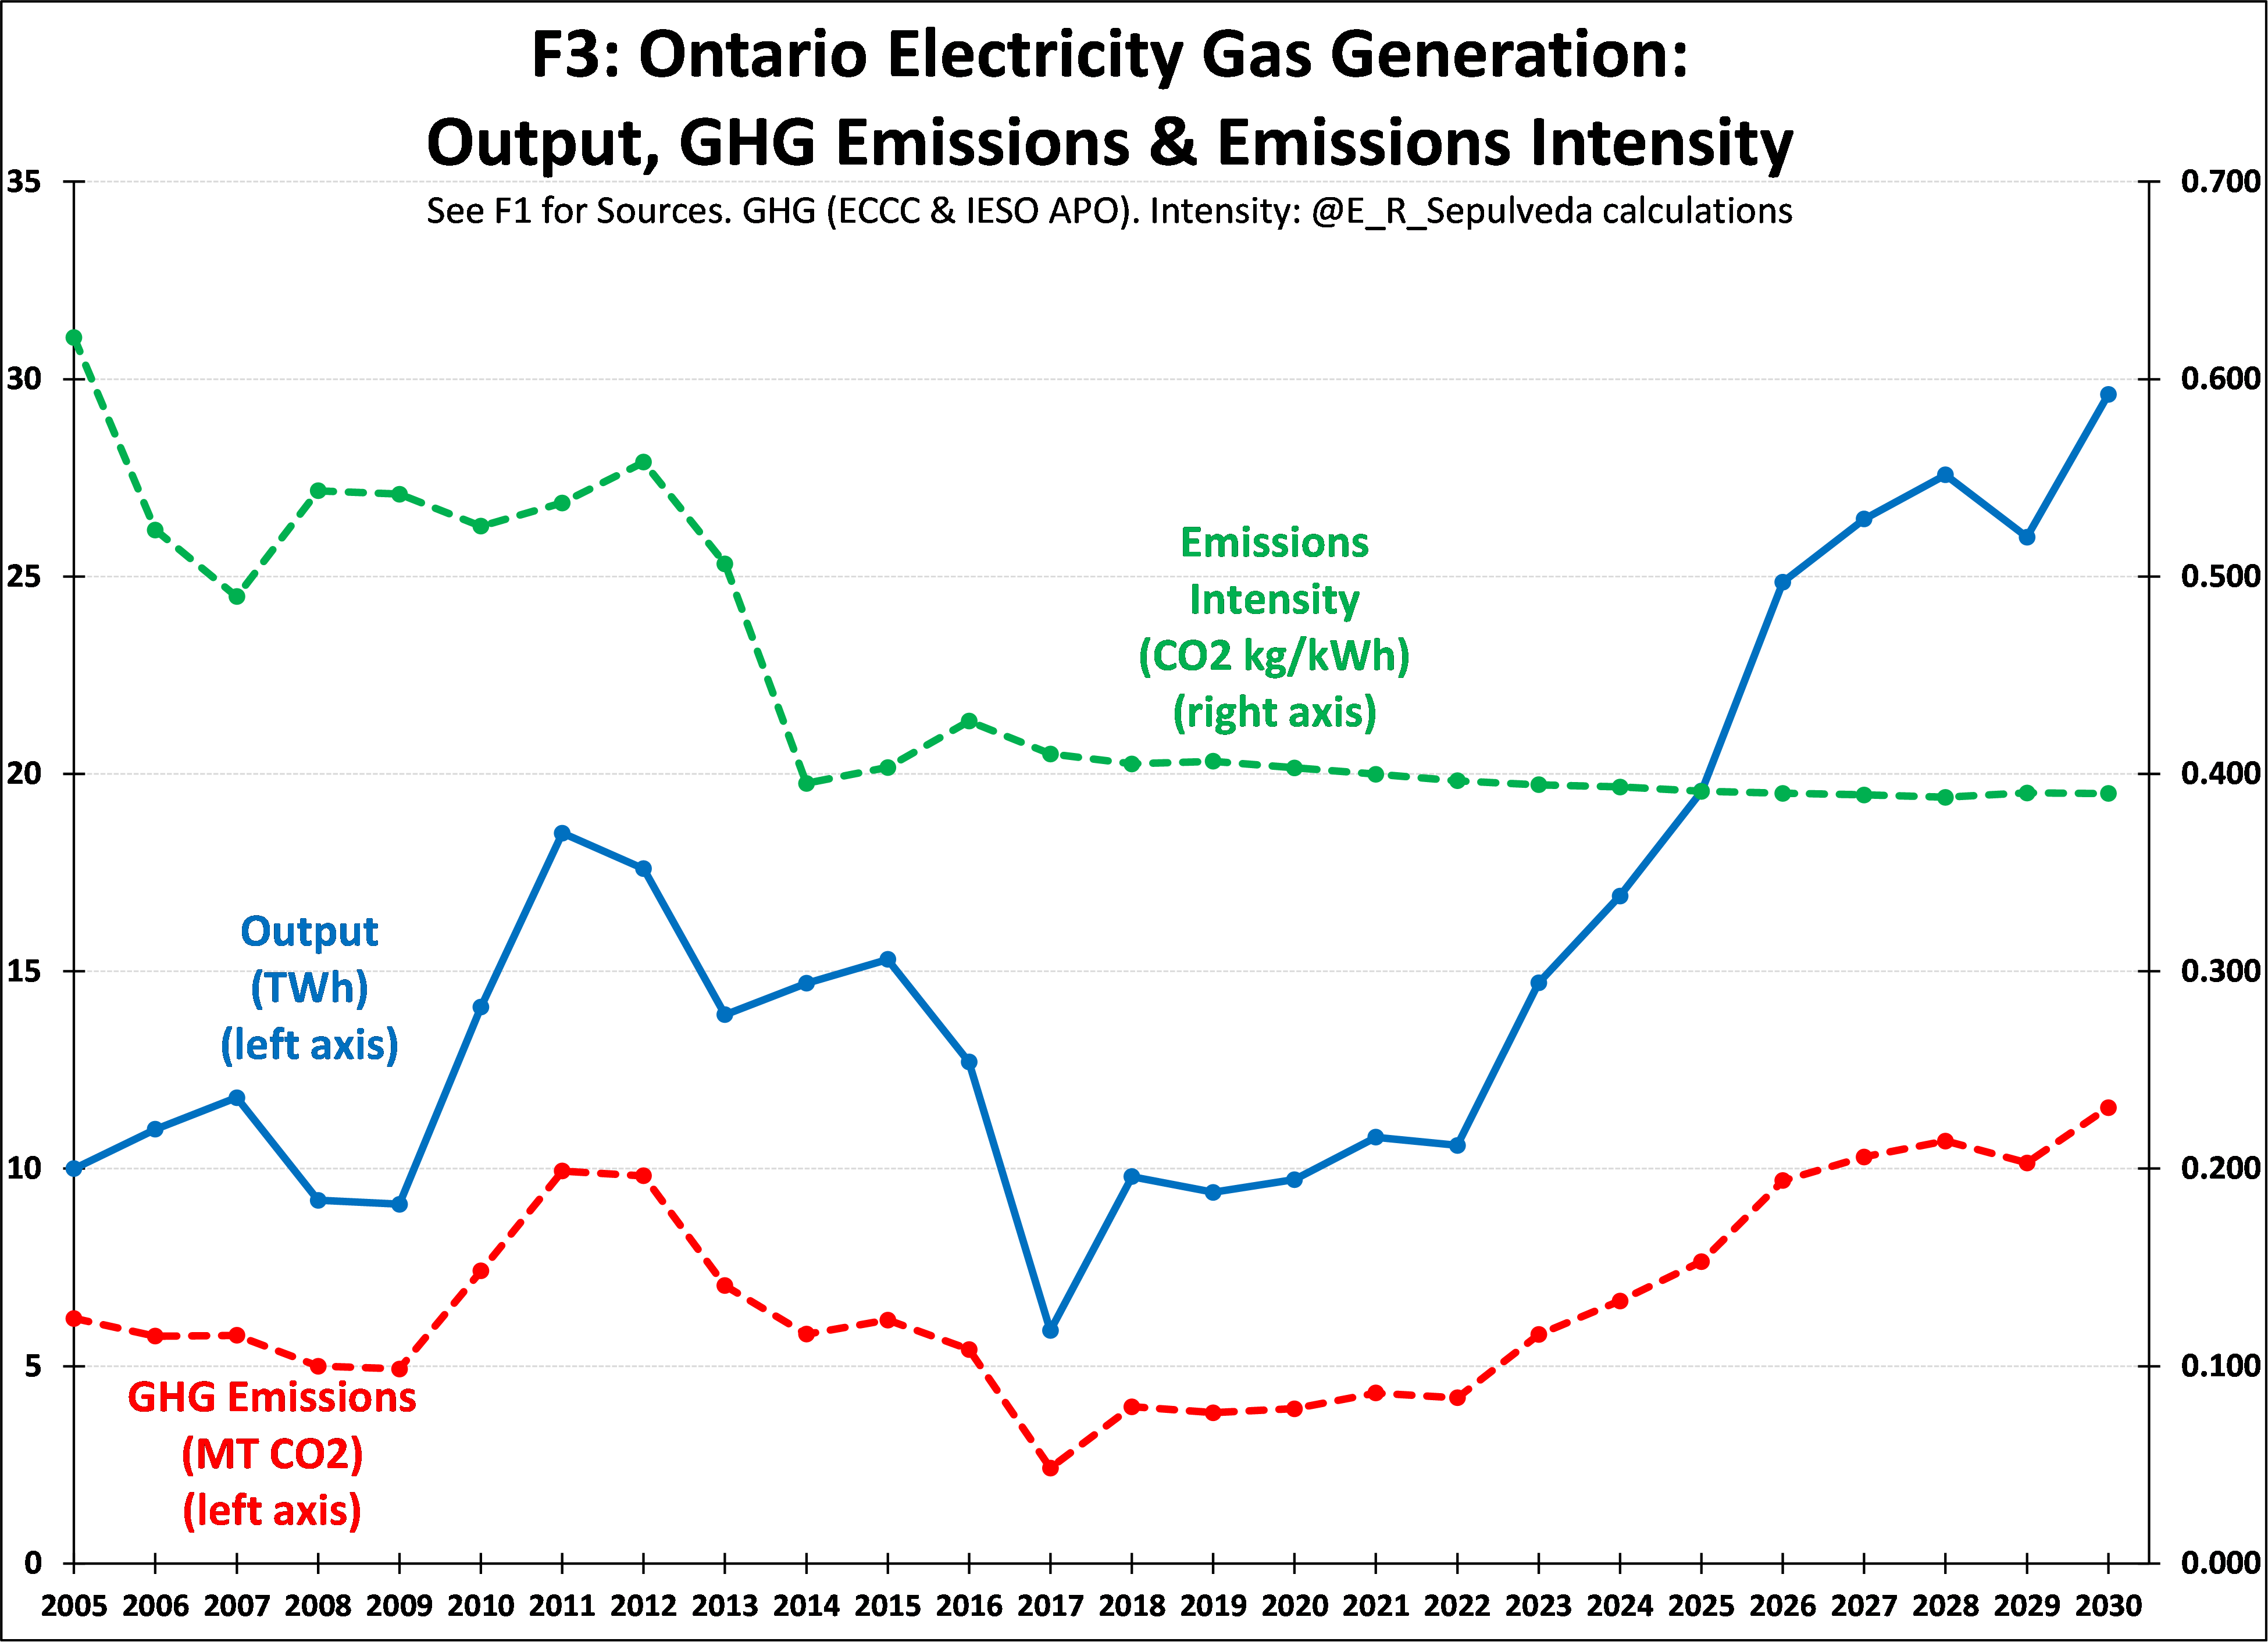
Figure 3 shows the emissions impact of this move away from nuclear to gas. GHG emissions from gas move more-or-less in step with output and are expected to increase to 10-11 MT for the 2027-2030 period, from the current range of about 4 MT. As Figure 3 shows, that 7MT increase to 11MT in 2030 would result in the highest ever emissions in Ontario for gas. And this is with the most modern and efficient gas plants. Figure 3 shows that gas emissions intensity has dropped significantly as newer gas plants have come online, from generally over 0.500 tCO2/MWh earlier in the period, to an average of 0.408 from 2014 to 2019. In its APO IESO expects this to decrease slightly to 0.390 by 2030.
So why would OPG decide to shutter PNGS? Clearly not for climate reasons, in spite of their net-zero commitment by 2040; under the current provincial Conservative government OPG went on a buying spree in 2019, purchasing two large existing gas plants from Trans-Canada Energy (TCE) and the remaining 50% of two others, so that under its newly-formed subsidiary Atura Power, it became the single largest gas generation company in Ontario with 2.7 GW of installed capacity. Adding to that is the OPG-held Lennox dual-fuel generation station and its shares in other gas generating stations, so OPG has a total has installed gas installed capacity of 4.8 GW or nearly half of installed gas capacity in Ontario.
The Market Surveillance Panel (MSP) of the Ontario Energy Board (OEB), the electricity sector regulatory agency, prepares semi-annual monitoring reports on the IESO-administered markets. In Report #32 released in July 2020 it noted the potential market power concerns associated with having one generation company, OPG, having 48% of installed gas generation capacity and 48% total Ontario installed capacity after its acquisitions. This was after the original recommendations on market opening in 2002, via the Market Power Mitigation Agreement (MPMA), that OPG reduce its market share of installed capacity from 90% pre-reform to 35%. It has overshot that 35% to the current 48%.
Why would the provincial Conservatives, the party of small business and free enterprise, allow OPG to bulk up? One possible explanation is that OPG could be a more attractive entity for privatization. That was the original plan of the provincial Conservatives in the 2002 reforms, but they backed off that initiative due to public opposition. It is perhaps ironic that the 51% privatization of Hydro One was done by the Liberals, that had apposed such selling off in 2002.
Speaking of politics, keen observers recall the out-sized role that gas generation and specific gas plants have played in Ontario politics. The “gas plants scandal” during the 2011 provincial election wherein the governing Liberals relocated two gas plants originally slated for Oakville and Mississauga, contributed to the resignation of the Liberal Premier McGuinty in 2013 and the criminal conviction of his Chief of Staff David Livingstone for “mischief in relation to data” and “attempted misuse of computer system to commit mischief” and served 35 days in jail in the summer of 2018. Perhaps ironically, it was the TCE-owned Oakville gas plant (that the Auditor General estimated cost tax-payers $675 million to relocate), that was eventually built in eastern Ontario near Bath. That Napanee generation station was one of the two that was sold by TCE to OPG in 2019.
So if the OEB and MoE won’t provide market power due diligence over OPG and the MoE will not do so from a climate perspective, perhaps Canada’s or Ontario’s carbon taxes can come to the rescue and mitigate this climate reversal?
Unfortunately, not as currently planned…..
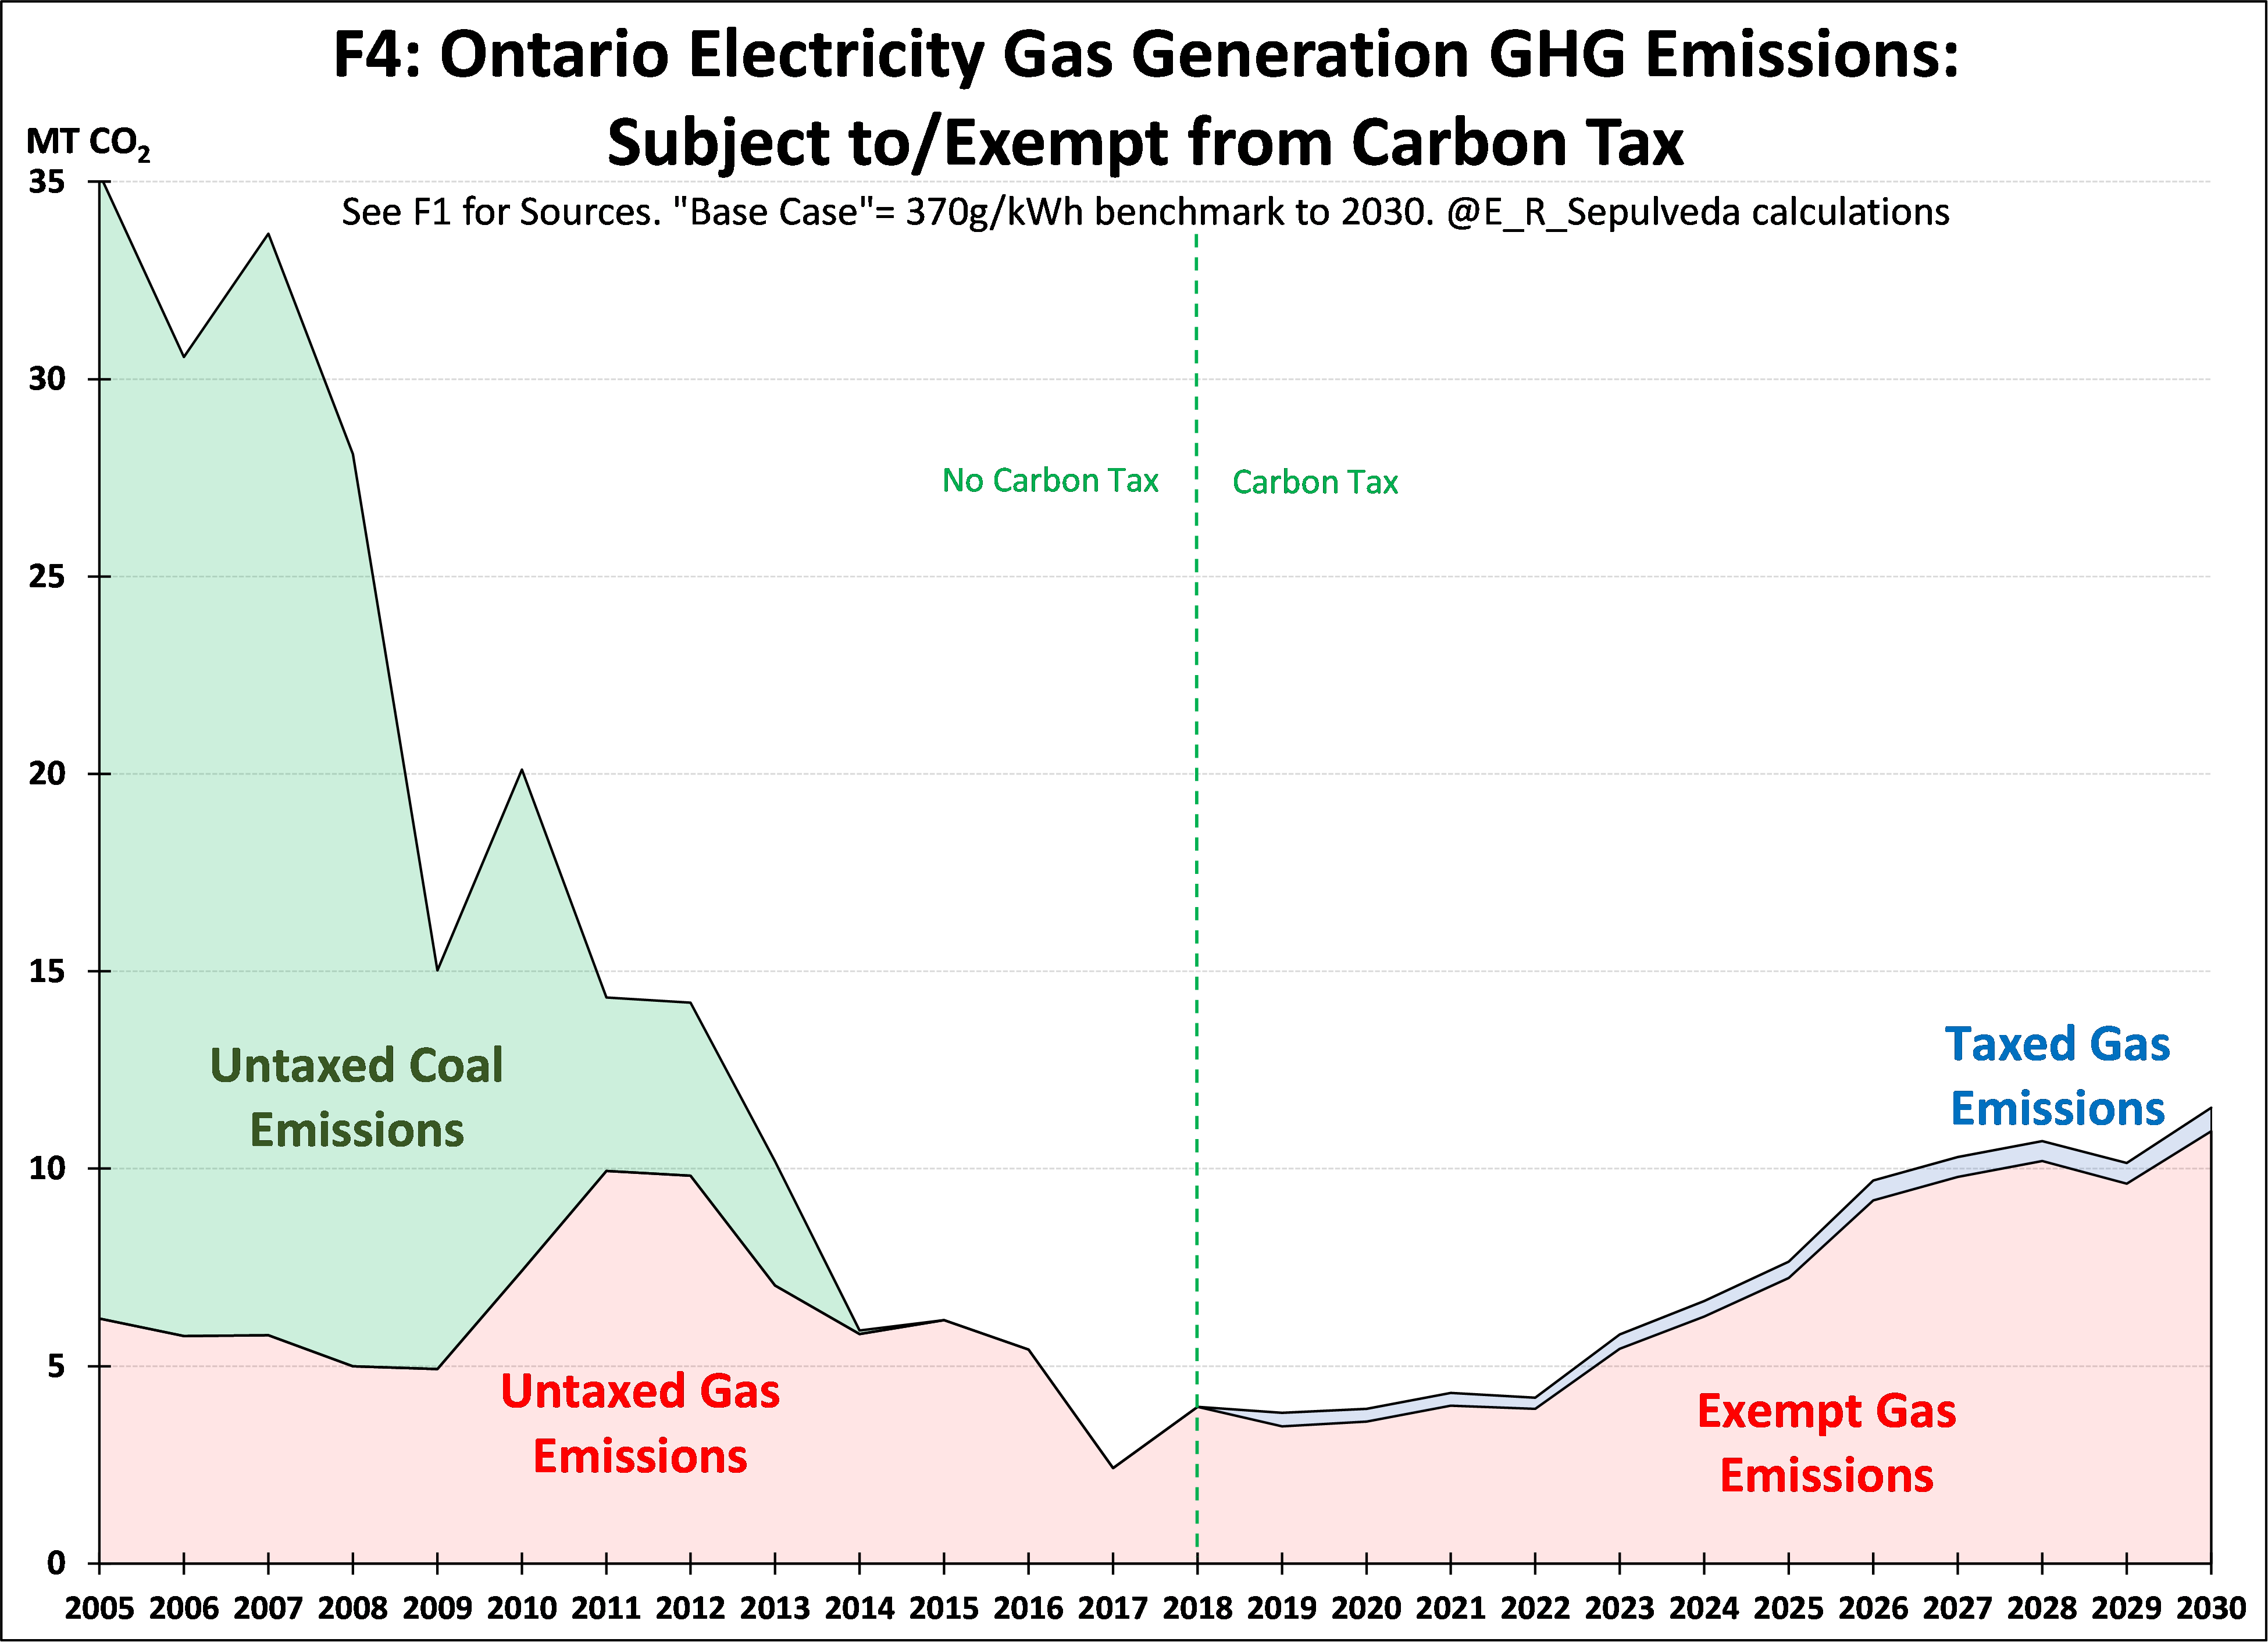
Figure 4 shows the minimal effect that the current and proposed carbon taxes, as currently-designed, are likely to have. I divide the time-line into pre-carbon tax (2005-2018) and post-carbon tax (2019-2030) periods. Data is from the same sources as in Figures 2 and 3. The first period coincides to the coal phase-out, which was done without a carbon tax, so I designate the coal and gas emissions as “untaxed”. This is a fundamentally important political-economy consideration – carbon taxes are neither necessary nor sufficient for decarbonization. But public ownership sure helps… All of the coal plants were owned by OPG; the coal phase-out was made more achievable in Ontario because the financial costs were absorbed by OPG under direction of its sole shareholder, the Province. A different set of challenges, including outright monetary compensation, apply when the State decides to shut down privately-owned coal plants in other provinces (e.g. Alberta, Nova Scotia, etc.).
For the second period, in which the carbon tax applies, the only GHG emitter remaining in Ontario is gas. The political economy of carbon taxes in general and how they relate to a federal country such as Canada could be the subject of a whole series of blogs, as could the relative role that carbon taxes could or should play in a decarbonization strategy.
Federal Backstops and “Made in Ontario” Alternatives
To focus the discussion, therefore, this post will not debate whether or not Canada or Ontario should have a carbon tax. In essence, and as a result of the recent Supreme Court of Canada decision that ruled the Federal “backstop” as constitutional, carbon taxes are the law of the land in Ontario. Given that, this post focuses on whether the carbon tax to be applied to the electricity sector in Ontario is likely to reduce GHG emissions in the short and long term.
So by way of background, Federal law stipulates that the Federal “back-stop” carbon taxes would apply in provinces that the Federal Government does not “certify” have a sufficiently stringent provincial carbon tax. The Federal scheme is based on an end-user fuel-specific levy and a separate large emitter programme, the Output Based Pricing System (OBPS). For example, the former applies to gasoline and diesel bought by consumers to power their cars and natural gas to power their heating furnaces, while the latter applies to specific cement producers and aluminum smelters facilities.
The OBPS is one type of what is generally-referred to as an emission trading system (ETS), sometimes called a “baseline or benchmark and credit” system. The other type of ETS is a “cap and trade” system. This is what had been proposed by the previous Liberal Government in Ontario, which was cancelled by the current provincial Conservatives, which triggered the back-stop application of the OBPS in Ontario for 2019, 2020 and 2021. As set out below, Ontario will return to a provincial programme, the Emission Performance Standard (EPS) in 2022. This yo-yo policy is in contrast with Quebec and BC which have had systems in place for over a decade that have been already “certified” by the Federal Government.
There are number of policy reasons that a jurisdiction would choose to impose an ETS. One of the reasons Governments implement ETS is that their design features make them very flexible to take into account local conditions and preferences. One aspect is degree of coverage, which I’ll cover further below. Another aspect relates to “carbon leakage”, which is the idea that in a globalized economy, over-taxation in jurisdiction A may reduce emissions in A, but could increase emissions in lower-taxation jurisdiction B. Hence, in “high emissions” and “trade exposed” sectors, ETS schemes typically have “benchmarks” or “performance” levels under which emissions are exempt. These levels are typically set at 80% to 95% of sector averages, so that only 20% or 5% of emissions would be taxed, respectively. The idea here is that the large emitters are still incentivized at the margin to reduce their emissions (the marginal carbon tax), but are not “over taxed” and thus made uncompetitive (by the lower average carbon tax, compared to if they had to pay on 100% of their emissions).
Electricity generation is generally not considered a “trade exposed” sector, yet it was included in the OBPS. This was a controversial decision by the Federal government. The technical reasons behind treating the electricity sector as a “trade exposed” has never been specifically explained by the Federal Government – my take is that it constitutes a form of “lowest common denominator” realpolitik compromise necessary to make the back-stop less unacceptable to Provinces with high-emission electricity sectors, such as Nova Scotia, New Brunswick, Alberta and Saskatchewan.
The problem is that Ontario is not a high-emission province. It is a low-emission province. So the OBPS Federal backstop designed for a “lowest common denominator” high-emitting province is a very bad fit in Ontario for three reasons:
- As argued above, electricity generation in Ontario is neither high-emission nor trade exposed, and hence does not meet the criteria for inclusion in a large emitter programme, whether the OBPS or the EPS.
- For Ontario, the OBPS/EPS are a) insufficiently stringent and b) have restrictively narrow coverage
- The lack of stringency will lead to low average carbon taxes and the narrow coverage will lead to relative under-investment in zero-emitting generation.
Low Stringency
The OBPS established a fuel-specific benchmark of 370 g/kWh for gas generation in Ontario. In effect, this exempts about 91% of gas emissions in Ontario, as set out in Table 1 (which also includes the data included in Figure 4). Last year the Federal Government “certified” Ontario’s proposed ETS, the Emission Performance Standard (EPS), which is now scheduled to take over from the OBPS in Ontario beginning January 2022. The EPS is a carbon copy (pardon the pun) of the OBPS as it relates to the electricity sector, with a one-year lag in the size of the carbon tax.

Neither the OBPS or the EPS set out stringency goals past 2022. Table 1 assumes that the current 370 g/kWh holds to 2030. The Base Case presented in Figure 4 and Table 1 would be a climate failure because it would exempt perhaps 95% of gas emissions by 2030. While the marginal incentive to abate would remain, the average cost to pollute would only be 5%, and so make gas generation cheaper to operate and make it relatively more attractive compared to zero-emission generation against which it competes.
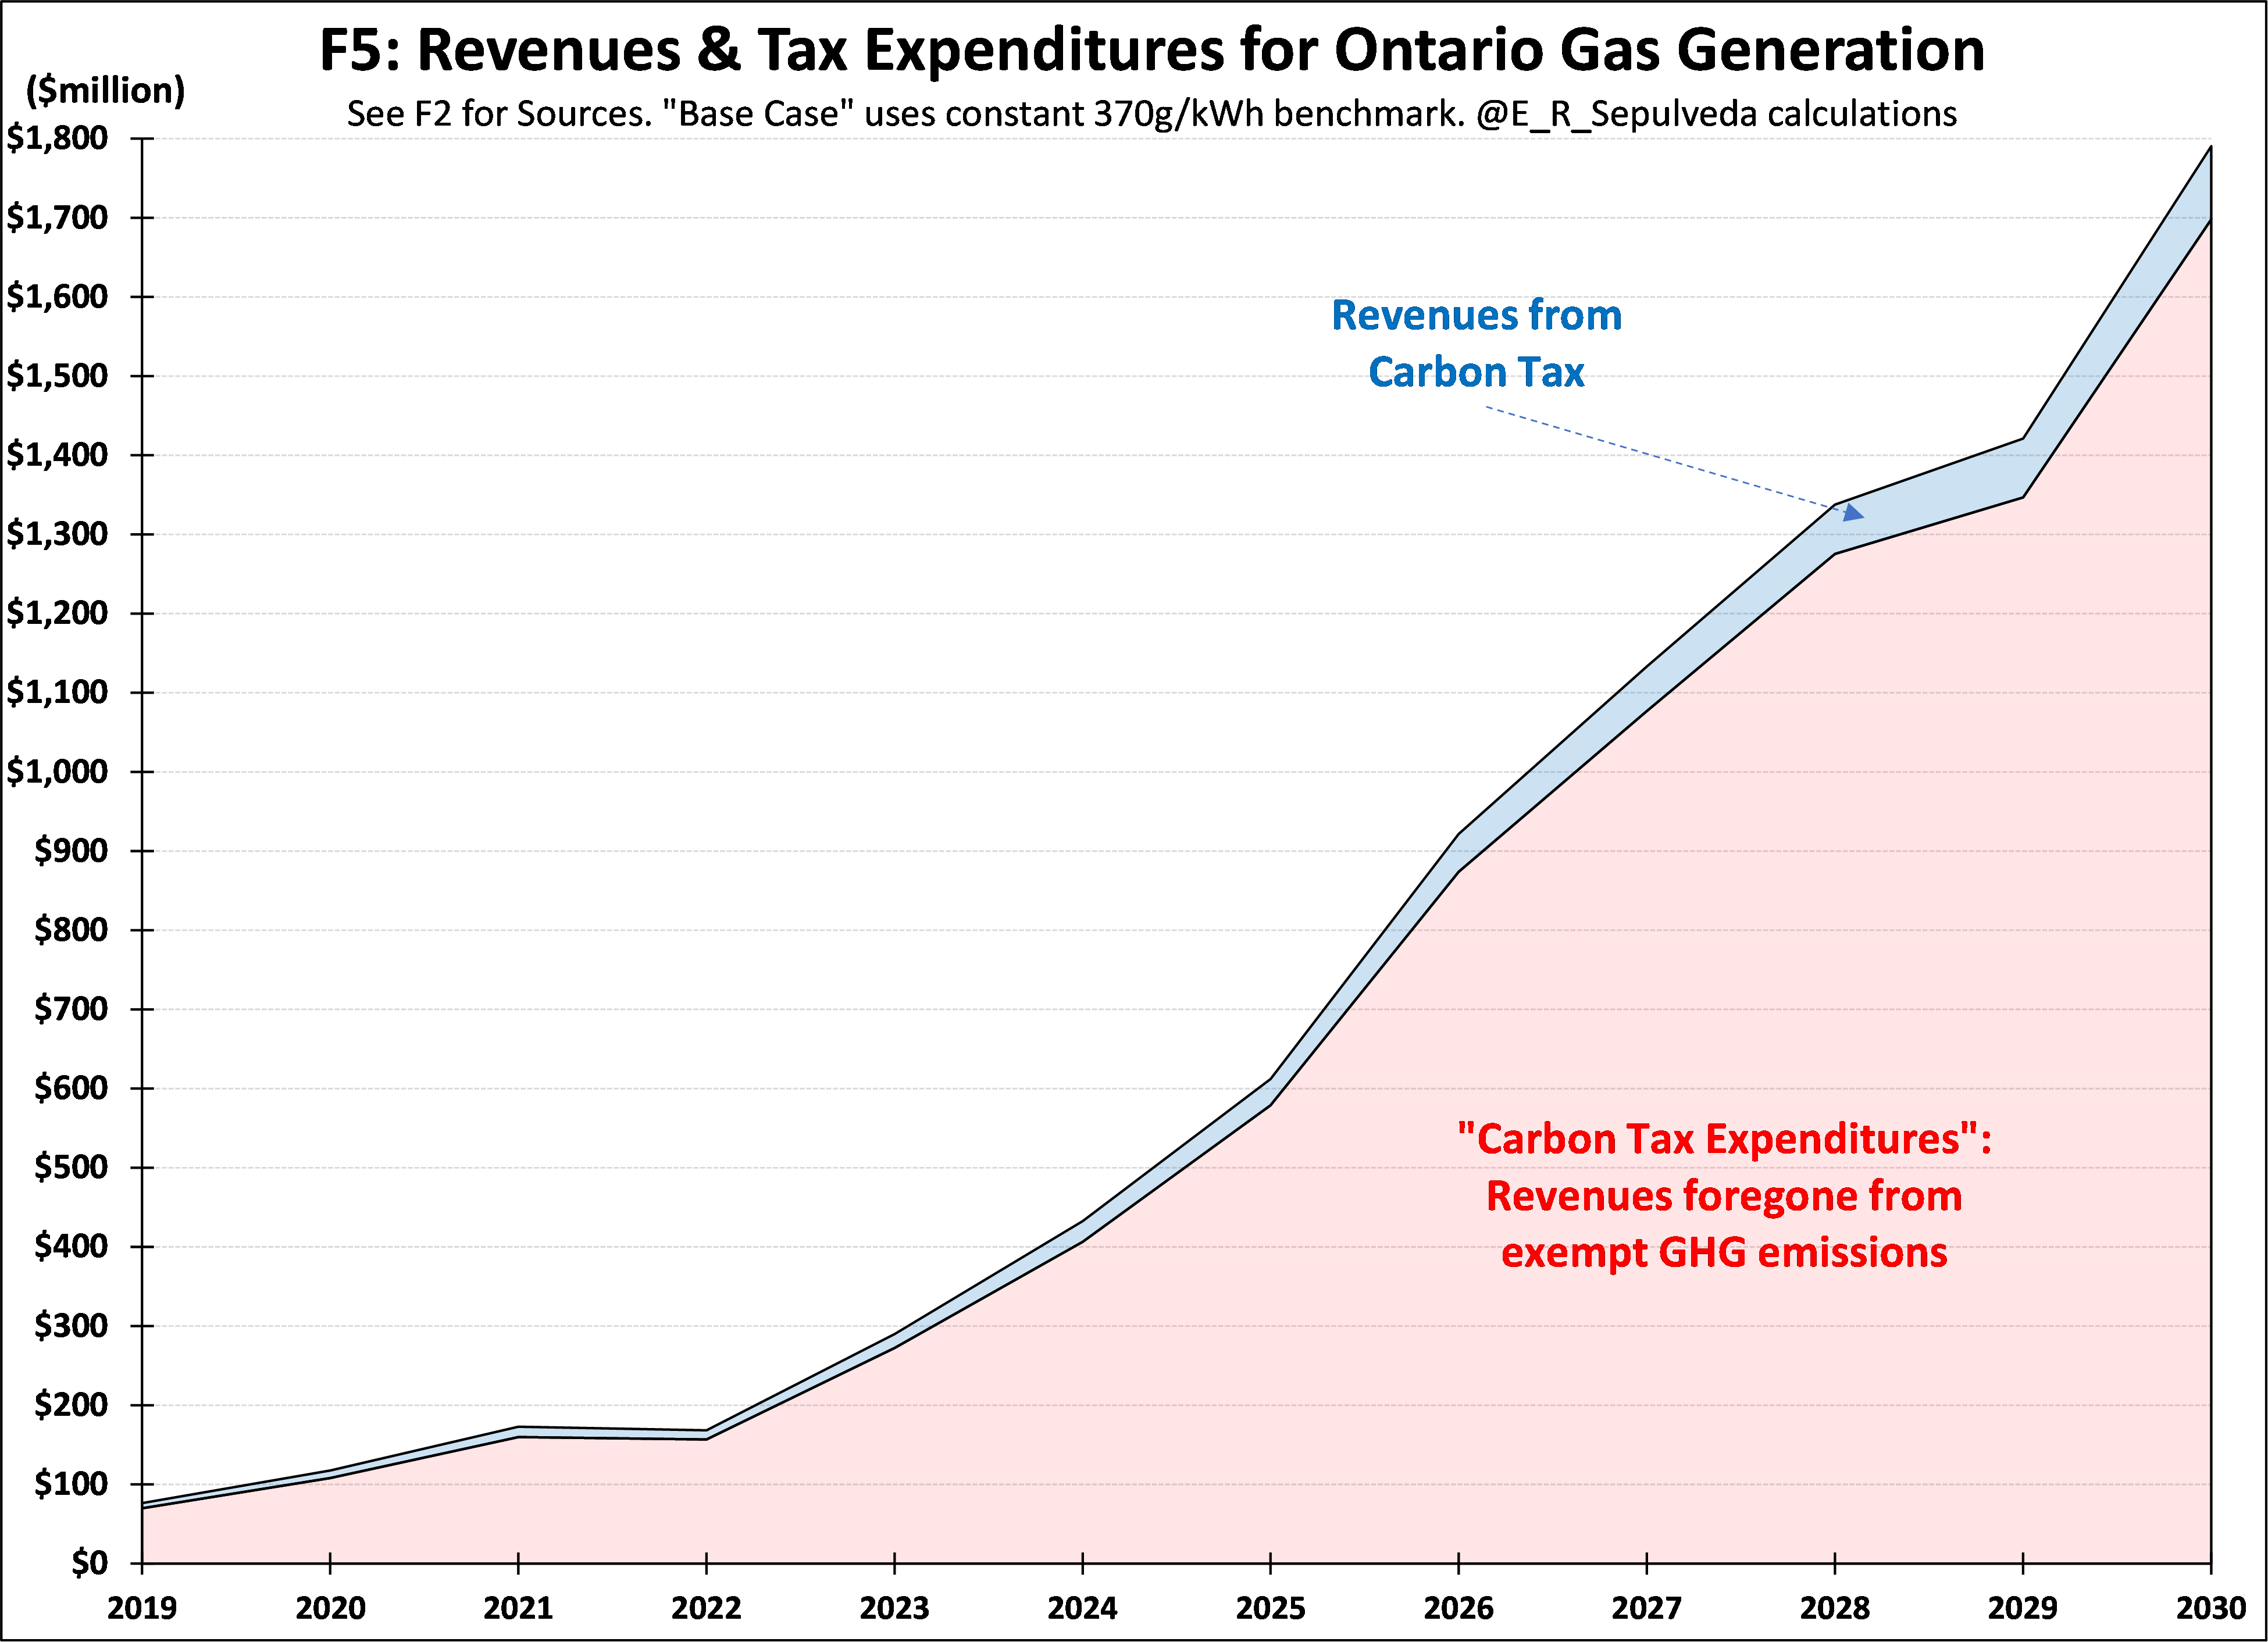
It would also be a financial failure. Figure 5 shows the estimated proceeds from the application of the carbon tax under the Base Case, collecting only about $90 million in 2030, while exempting $1,700 million. In fiscal economics we call this “tax expenditures” the dollar amount of forgone revenues from the application of exemptions or deductions, commonly referred to as “loopholes”.
Increasing Stringency “Alternative A”: Gradual reduction of the Exemption
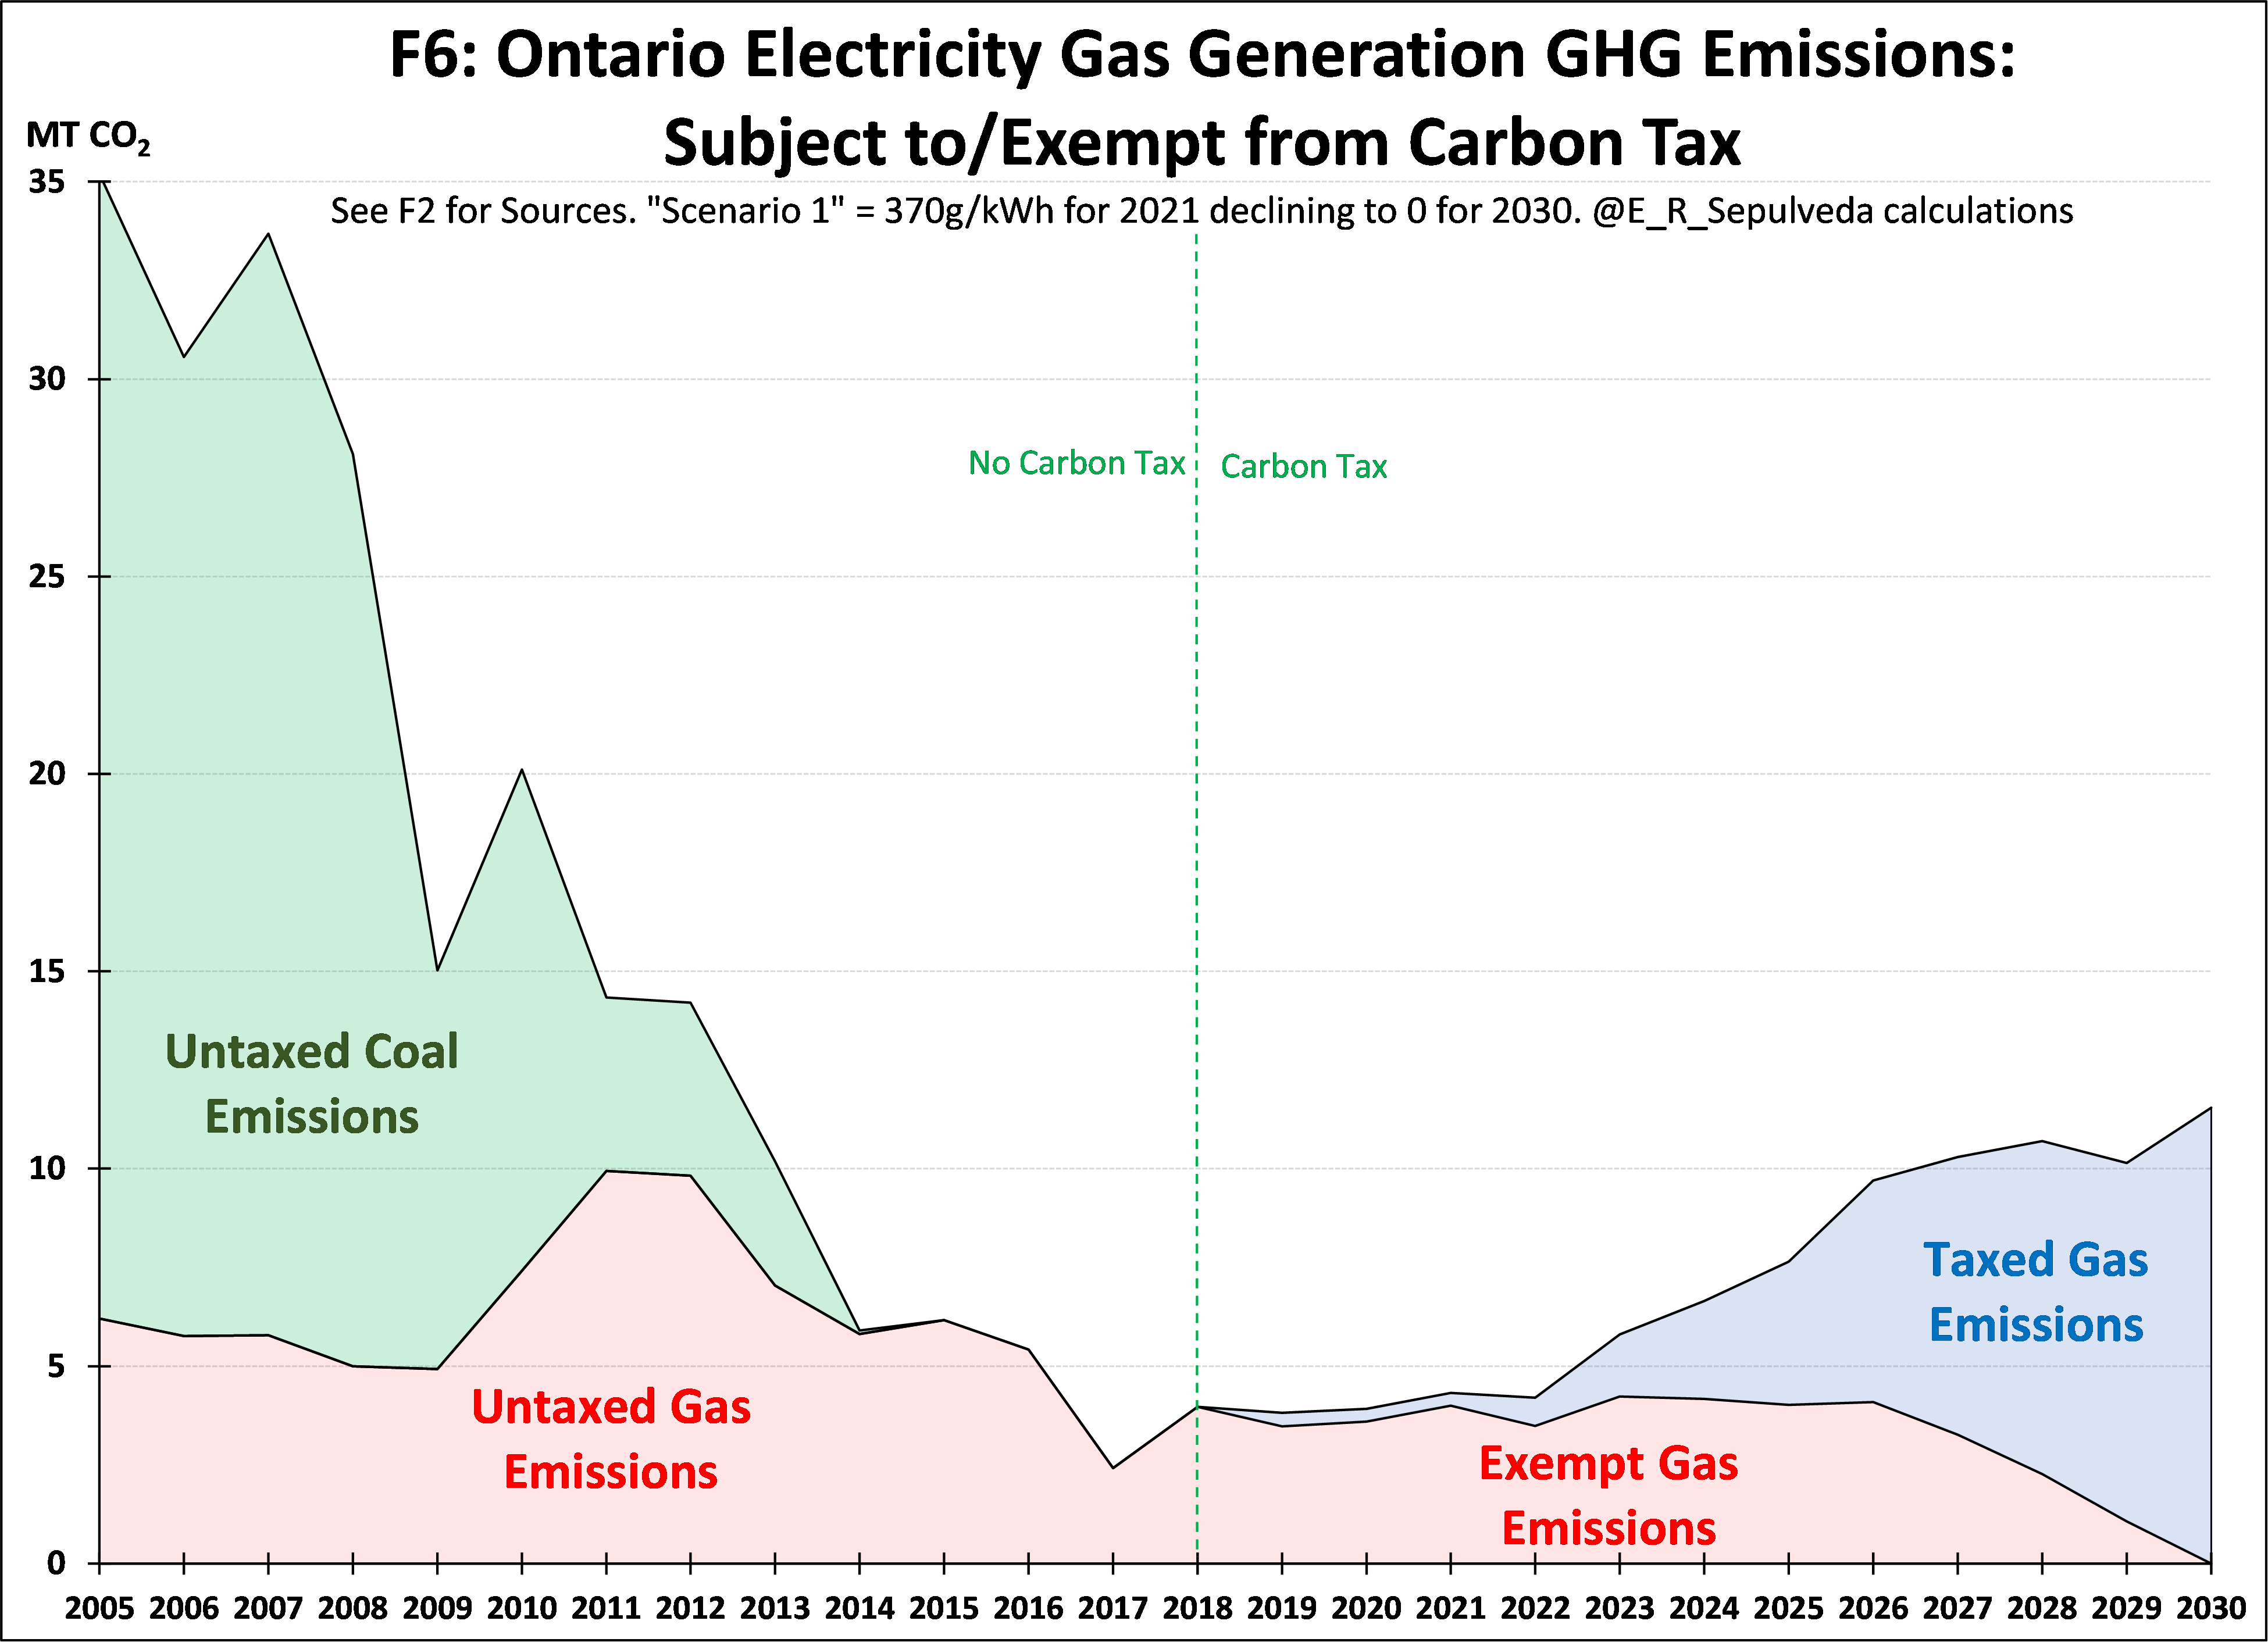
What would happen if the MoE were to decide to gradually eliminate the current benchmark exemption? Could be in 2023 or in 2030 or some other time. Table 2 shows the static results of Alternative A which would lower the 370 g/kWh benchmark starting in 2022 to zero in 2030 , thus reducing exempted emissions to 0% by that same date. This Alternative A would essentially remove the electricity sector in Ontario from the EPS and have it treated like any other consumer or industry that has to pay carbon taxes on 100% of their emissions.

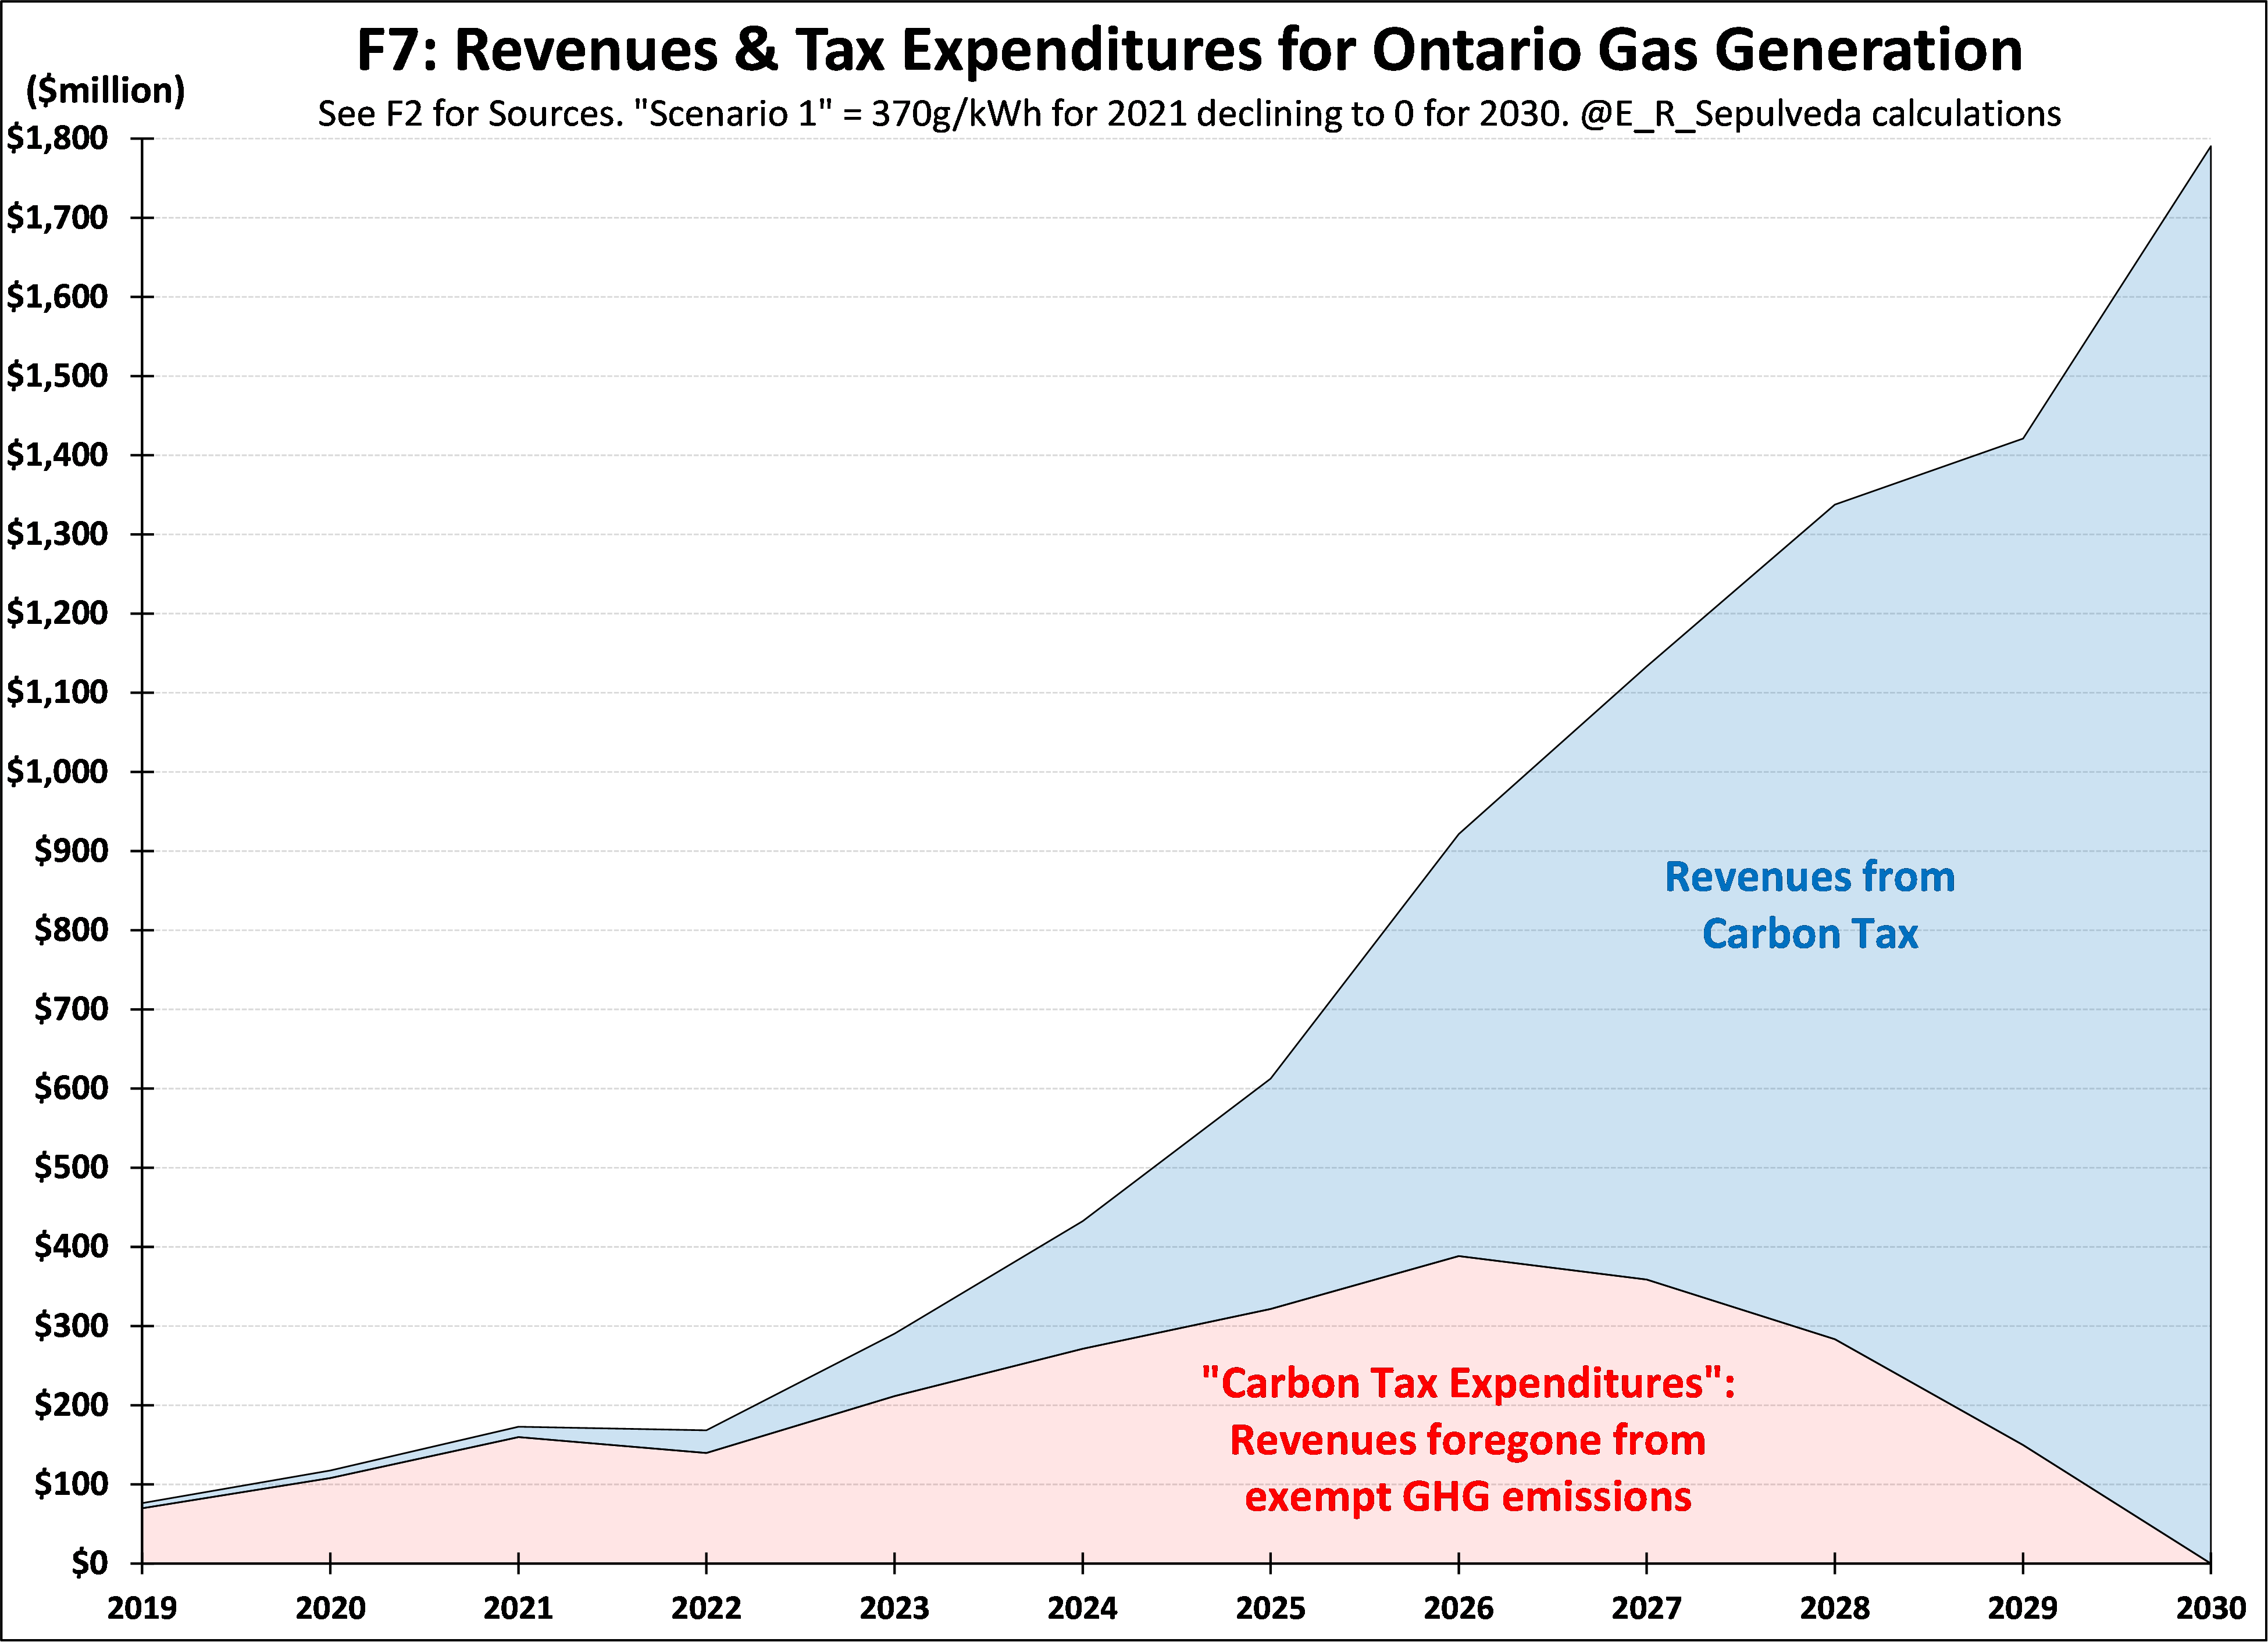
Figures 6 and 7 are the Alternative A equivalents of the Base Case Figures 4 and 5, showing the evolution of taxed and exempt emissions, and the taxation revenues and tax expenditures, respectively. Note, these are all “static” calculations, assuming (unrealistically) that that there is no abatement as a result of higher stringency – I will leave the calculation of dynamic responses to those with specific models. One example of such modelling, is here, for instance.
Narrow Programme Coverage – Base Case
For carbon taxes to play their theoretical role of revealing socially-optimal prices, coverage should be as broad as possible, including in the electricity sector. This is not the case for the OBPS, which only covers fossil fuel generation and has a fuel-specific benchmark. This means that non-fossil zero-emission generation, including nuclear, wind and solar, are uncovered and therefore are not eligible to receive credits for emissions under the relevant benchmarks. ETS schemes do not have to be designed in this manner – the recently-revised TIER scheme in Alberta covers all generation technologies, resulting in an even level playing field and has been proposed as a better alternative to the OBPS, and by extension, the EPS.
Table 3, which is the Base Case, is how the EPS is currently designed. For illustrative purposes, I have calculated a “typical” forward-looking year, based on the average 2022-2030 period. This includes a period average carbon tax of $100 which is only applicable to gas generation. Table 3 shows that the EPS only covers gas, which has a benchmark exemption of 0.370 CO2 kg/kWh, average emission intensity of 0.391 and output of 22 TWh. The resulting payment in carbon taxes is $45 million for that average/typical year. The formula is (0.391 – 0.370) * 22 * $100 = $45 million.

Sector-Wide Coverage – Alternative B
In contrast, Table 4, which is the Alternative B, is the scenario under which all generation technologies are covered by the EPS, as is the case in Alberta under the TIER. The EPS benchmark could stay the same at 370 g/kWh, but that would create a surplus of sector compliance units (credits). This is not necessarily a problem if other covered sectors in the economy are in deficit, so that as whole the covered sectors are in rough balance. But for this scenario I want to set the benchmark to roughly balance the net tax/credits, relative to the Base Case. I do this by applying the principle of setting the performance level at between 80-95% of average sector emissions intensity. Specifically I set the standard at 0.055 tCO2/MWh in Table 4 so as to have the same net tax/credits as the Base Case ($45 million). Other alternatives are, of course, possible.
Using the same formula, we can calculate what would be the results of Alternative B. One difference would be much higher payments by gas plants. On the other hand, low and zero emission generation would now receive credits. Overall, the net proceeds of the scheme would remain the same. The value of the credits would of course be determined based on trading, but for simplicity I set them in Table 4 to have the same value of as the corresponding carbon tax. As above, these are only static results.

In comparing these two scenarios it is clear from Table 3 that only covering fossil fuel generation sends the wrong climate investment signals with respect to electricity generation. The difference in carbon taxes paid per MWh between gas and hydro, for example is only $2.08/MWh. In contrast, Table 4 levels the playing field by ensuring that zero-emissions technologies are credited relative to gas generation. The difference in carbon prices paid between gas and nuclear, for example, increases by nearly 20 times, to $39.08/MWh, making zero-emission generation relatively much more attractive, which is one of the goals of carbon taxes! Would OPG have made the same decision not to refurbish PNGS and buy nearly 3GW of gas plants if it had faced these set of relative prices reflecting carbon costs?
Further layers of complexity could be added to Table 4 to take into account price, cost and subsidy levels. For example, the Alberta TIER scheme, some non-hydro renewables that are already subsidized are therefore not eligible for carbon credits.
Concluding Thoughts
The provincial Conservatives touted the EPS as a “made in Ontario” solution to climate change. As it relates to the electricity sector, the EPS, when in comes into force in January 2022, is a continuation of the Federal Liberal non-solution that is the OBPS. This is perhaps not surprising because Ontario was one of the three provinces that challenged the constitutionality of the Federal backstop, on which the Supreme Court has recently ruled. In parallel, the provincial Conservatives were working to replace the OBPS with the EPS (there are no plans to replace the federal fuel levy, which continues to apply in Ontario). Given this political context, the provincial Conservatives were never going to make the EPS more stringent than the OBPS, regardless of the conditions “on the ground” in Ontario.
That is a pity, and a wasted opportunity.
As proposed, for the electricity sector in Ontario, the EPS is fatally flawed. One, the electricity sector is neither emissions-intensive nor trade exposed, so it should not be included in the EPS in principle. Two, by only covering non-fossil generation technologies, the EPS tilts the playing field in favour of fossil generation and disincentivizes future investment in zero-emission generation. Three, the EPS will exempt about 91% of fossil generation in Ontario when it comes into effect in 2022, a figure that is likely to increase to perhaps 95% by 2030.
It is clear that the provincial Conservatives will not change course on the electricity file before the next Ontario provincial election scheduled for the summer of 2022. By then they would have spent another $6.5 billion of Government revenues to keep electricity prices low and out of the headlines. Also by that time the EPS would have been in place for half a year, with gas generators paying carbon taxes on 9% of their emissions. Such low emissions carbon tax coverage is likely to have a minimal impact on end-user electricity rates, which is perhaps why it is favoured by the current Conservative Government? The inequity, however, of residential consumers using the very same gas would of course continue to pay the fuel levy on the full 100% of their consumption to heat their homes, is presumably something that they would prefer not be shouted from the rooftops….
Will electricity play its out-sized role in the 2022 election that it did in the three previous Ontario elections? I think yes – the decision to shutter Pickering and thus increase GHG emissions from additional gas generation and not to seriously tax those emissions are all political decisions. Previous elections focussed on political corruption in the handling of the electricity file and on rising electricity prices that increased inequality that drove energy poverty. With heightened public awareness of climate change, the key role that the electricity sector could play in decarbonization in Ontario should make it an important election topic in 2022.