Ontario Election: Inequality Impacts of Fiscal Plans
In the context of Ontario’s upcoming June 7 election, I just finalized an article on the CCPA’s “Behind the Numbers” blog, exploring the fiscal plans of the three major political parties from a historical and comparative context. I concluded that while the Ontario election offers voters three distinct fiscal visions, it is also true that all three would maintain Ontario’s comparatively low program expenditures and own-source revenues, at least during their first term. Building on my prior work examining the impact of fiscal policy on inequality, I develop a novel, regression-based model to forecast the impact that each fiscal plan is likely to have on income inequality in Ontario, as measured by the after-tax income Gini coefficient and conclude that the NDP would decrease inequality moderately, the Liberals would decrease it slightly, and the PCs would increase it significantly.
Ontario Inequality in Context
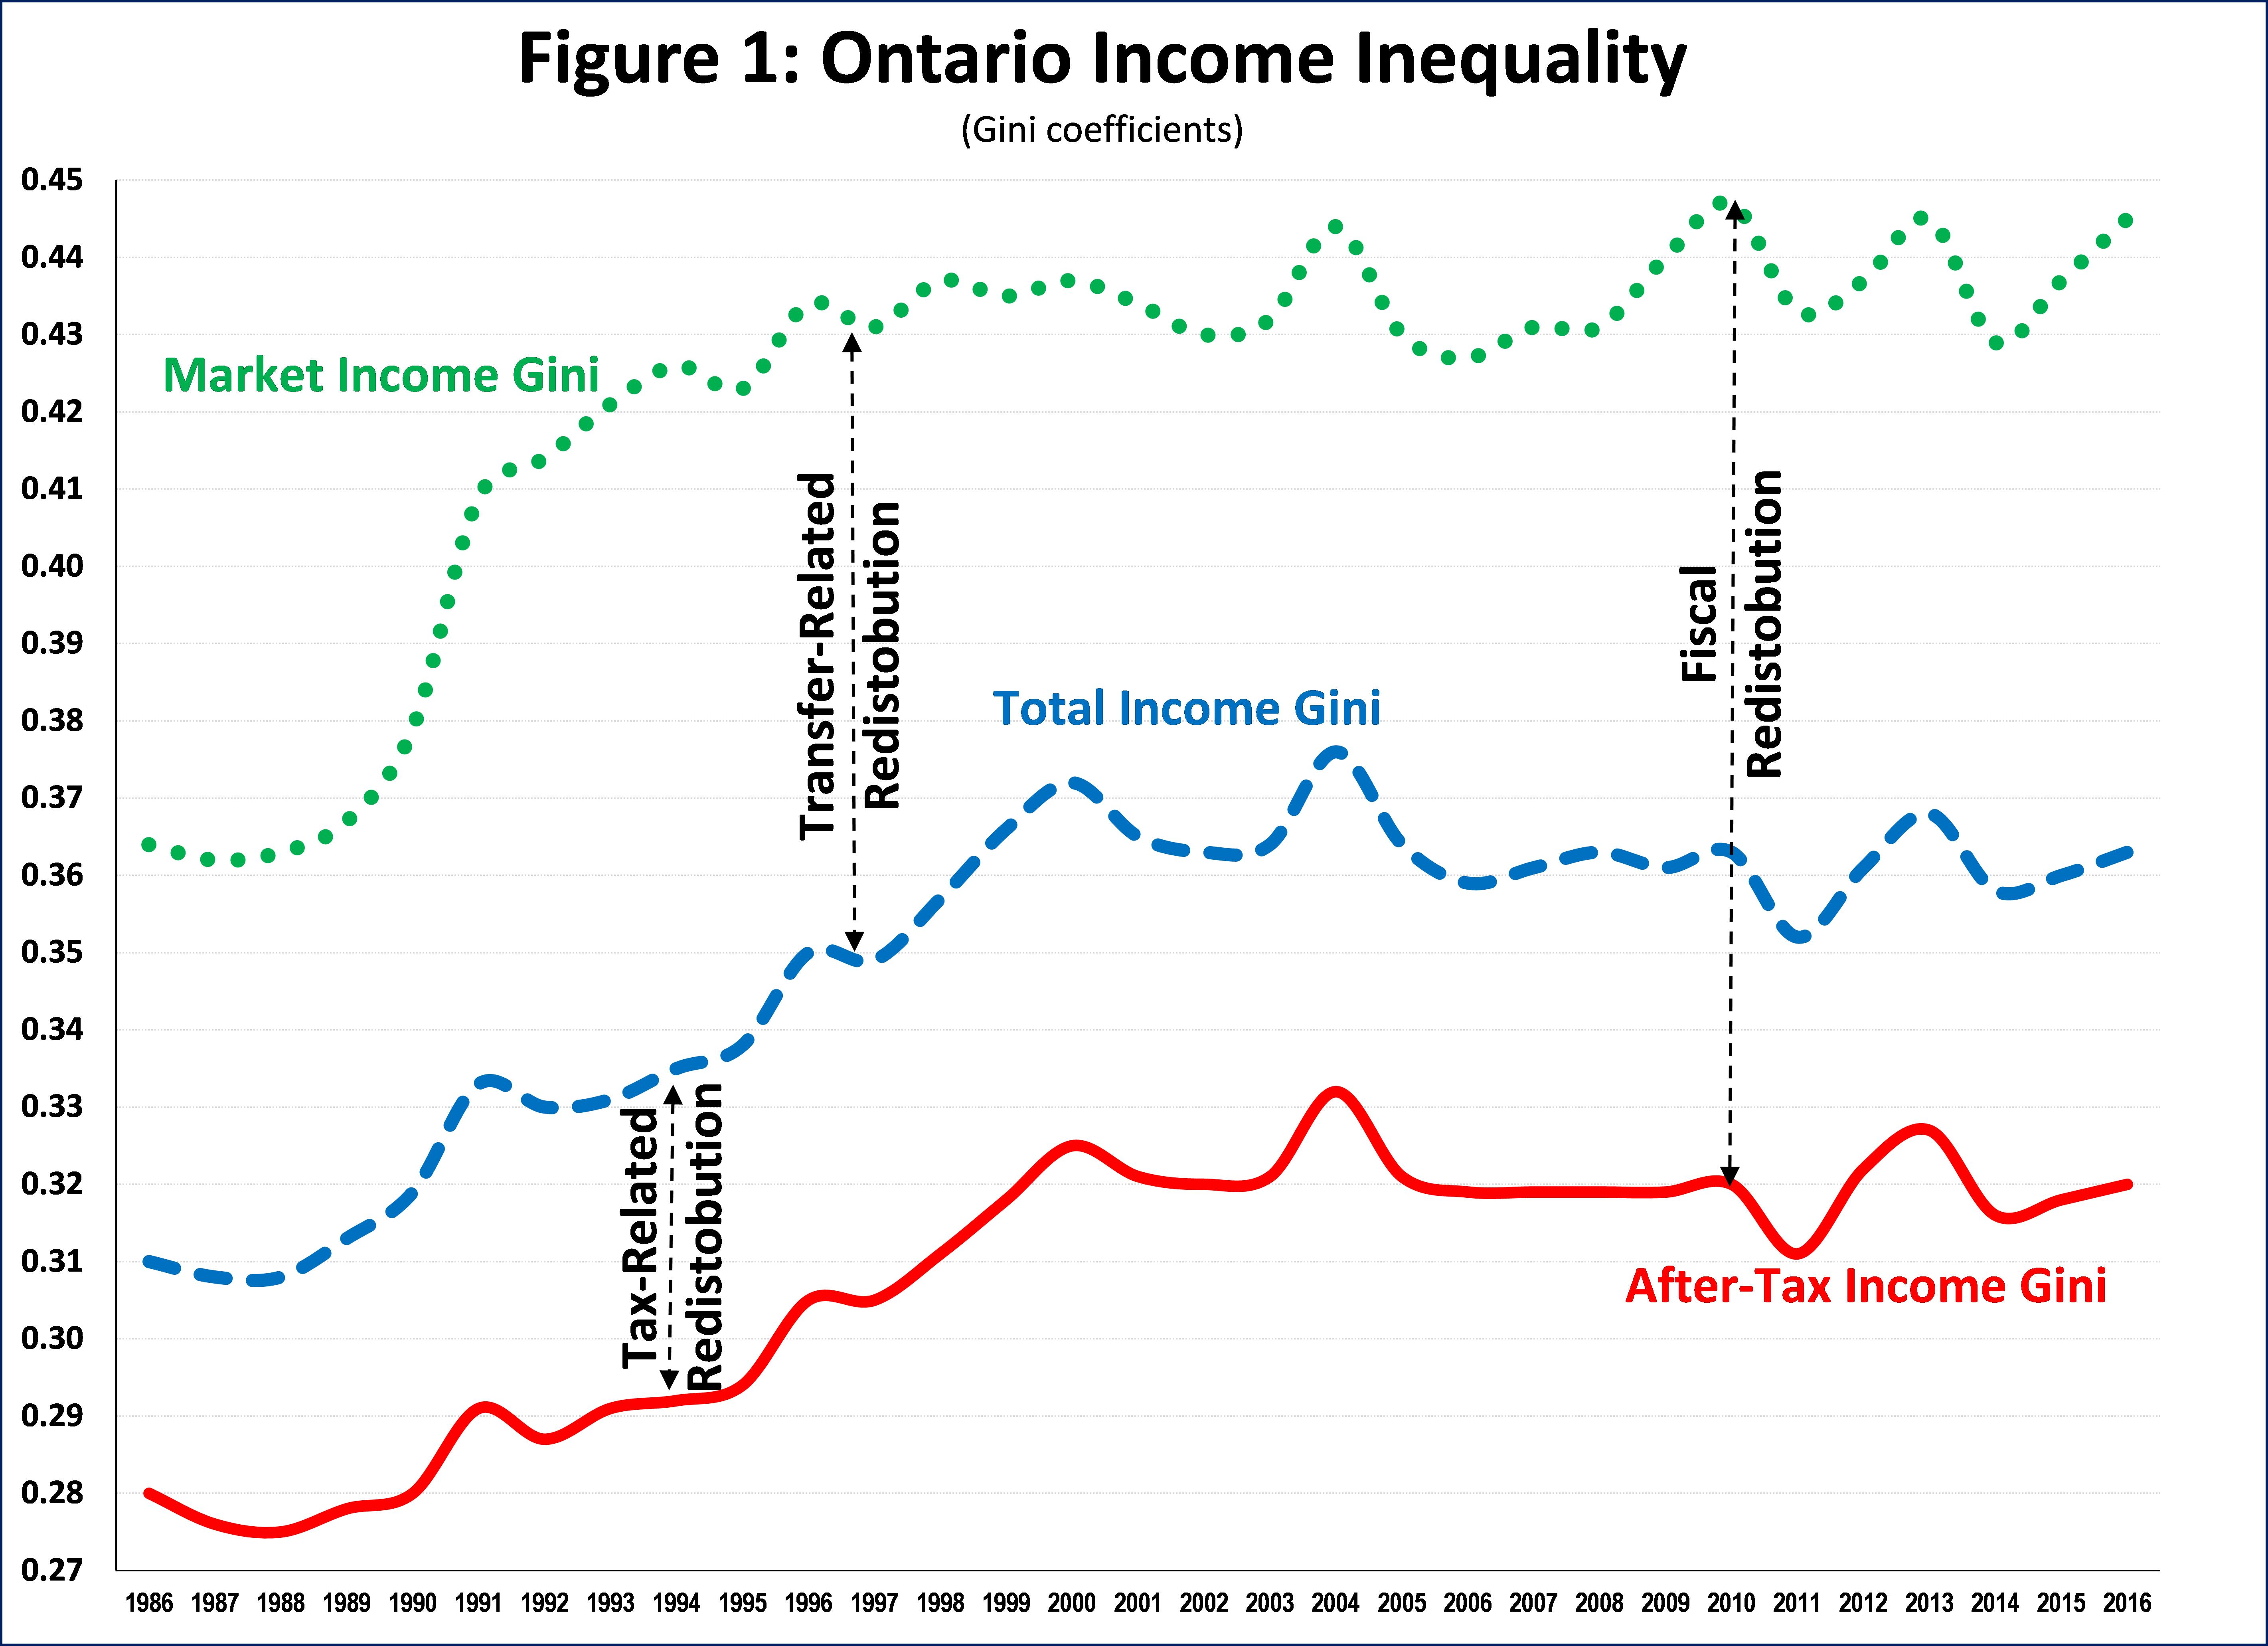
Figure 1 presents “market income,” “total income” and “after-tax income” Gini coefficients for Ontario from 1986 to 2016. Market income is before taxes and government cash transfers, total income includes market income and cash transfers, while after-tax income is after taxes and cash transfers. The Gini coefficient varies from 0 to 1.00, with higher values representing higher inequality. Figure 1 shows a significant increase in inequality for all measures over the first decade of the study period, after which most Gini coefficients stabilize.
Governments reduce market inequality via the tax and transfer systems, and hence after-tax, income Gini coefficients are lower than market income coefficients. I define this difference as “Fiscal Redistribution”. There are two components of Fiscal Redistribution. One is related to cash transfers and is the difference between total income and market income Gini coefficients, which I define as “Transfer Redistribution”. The other is related to taxes and is the difference between after-tax and total income Gini coefficients, which I refer as “Tax Redistribution”.
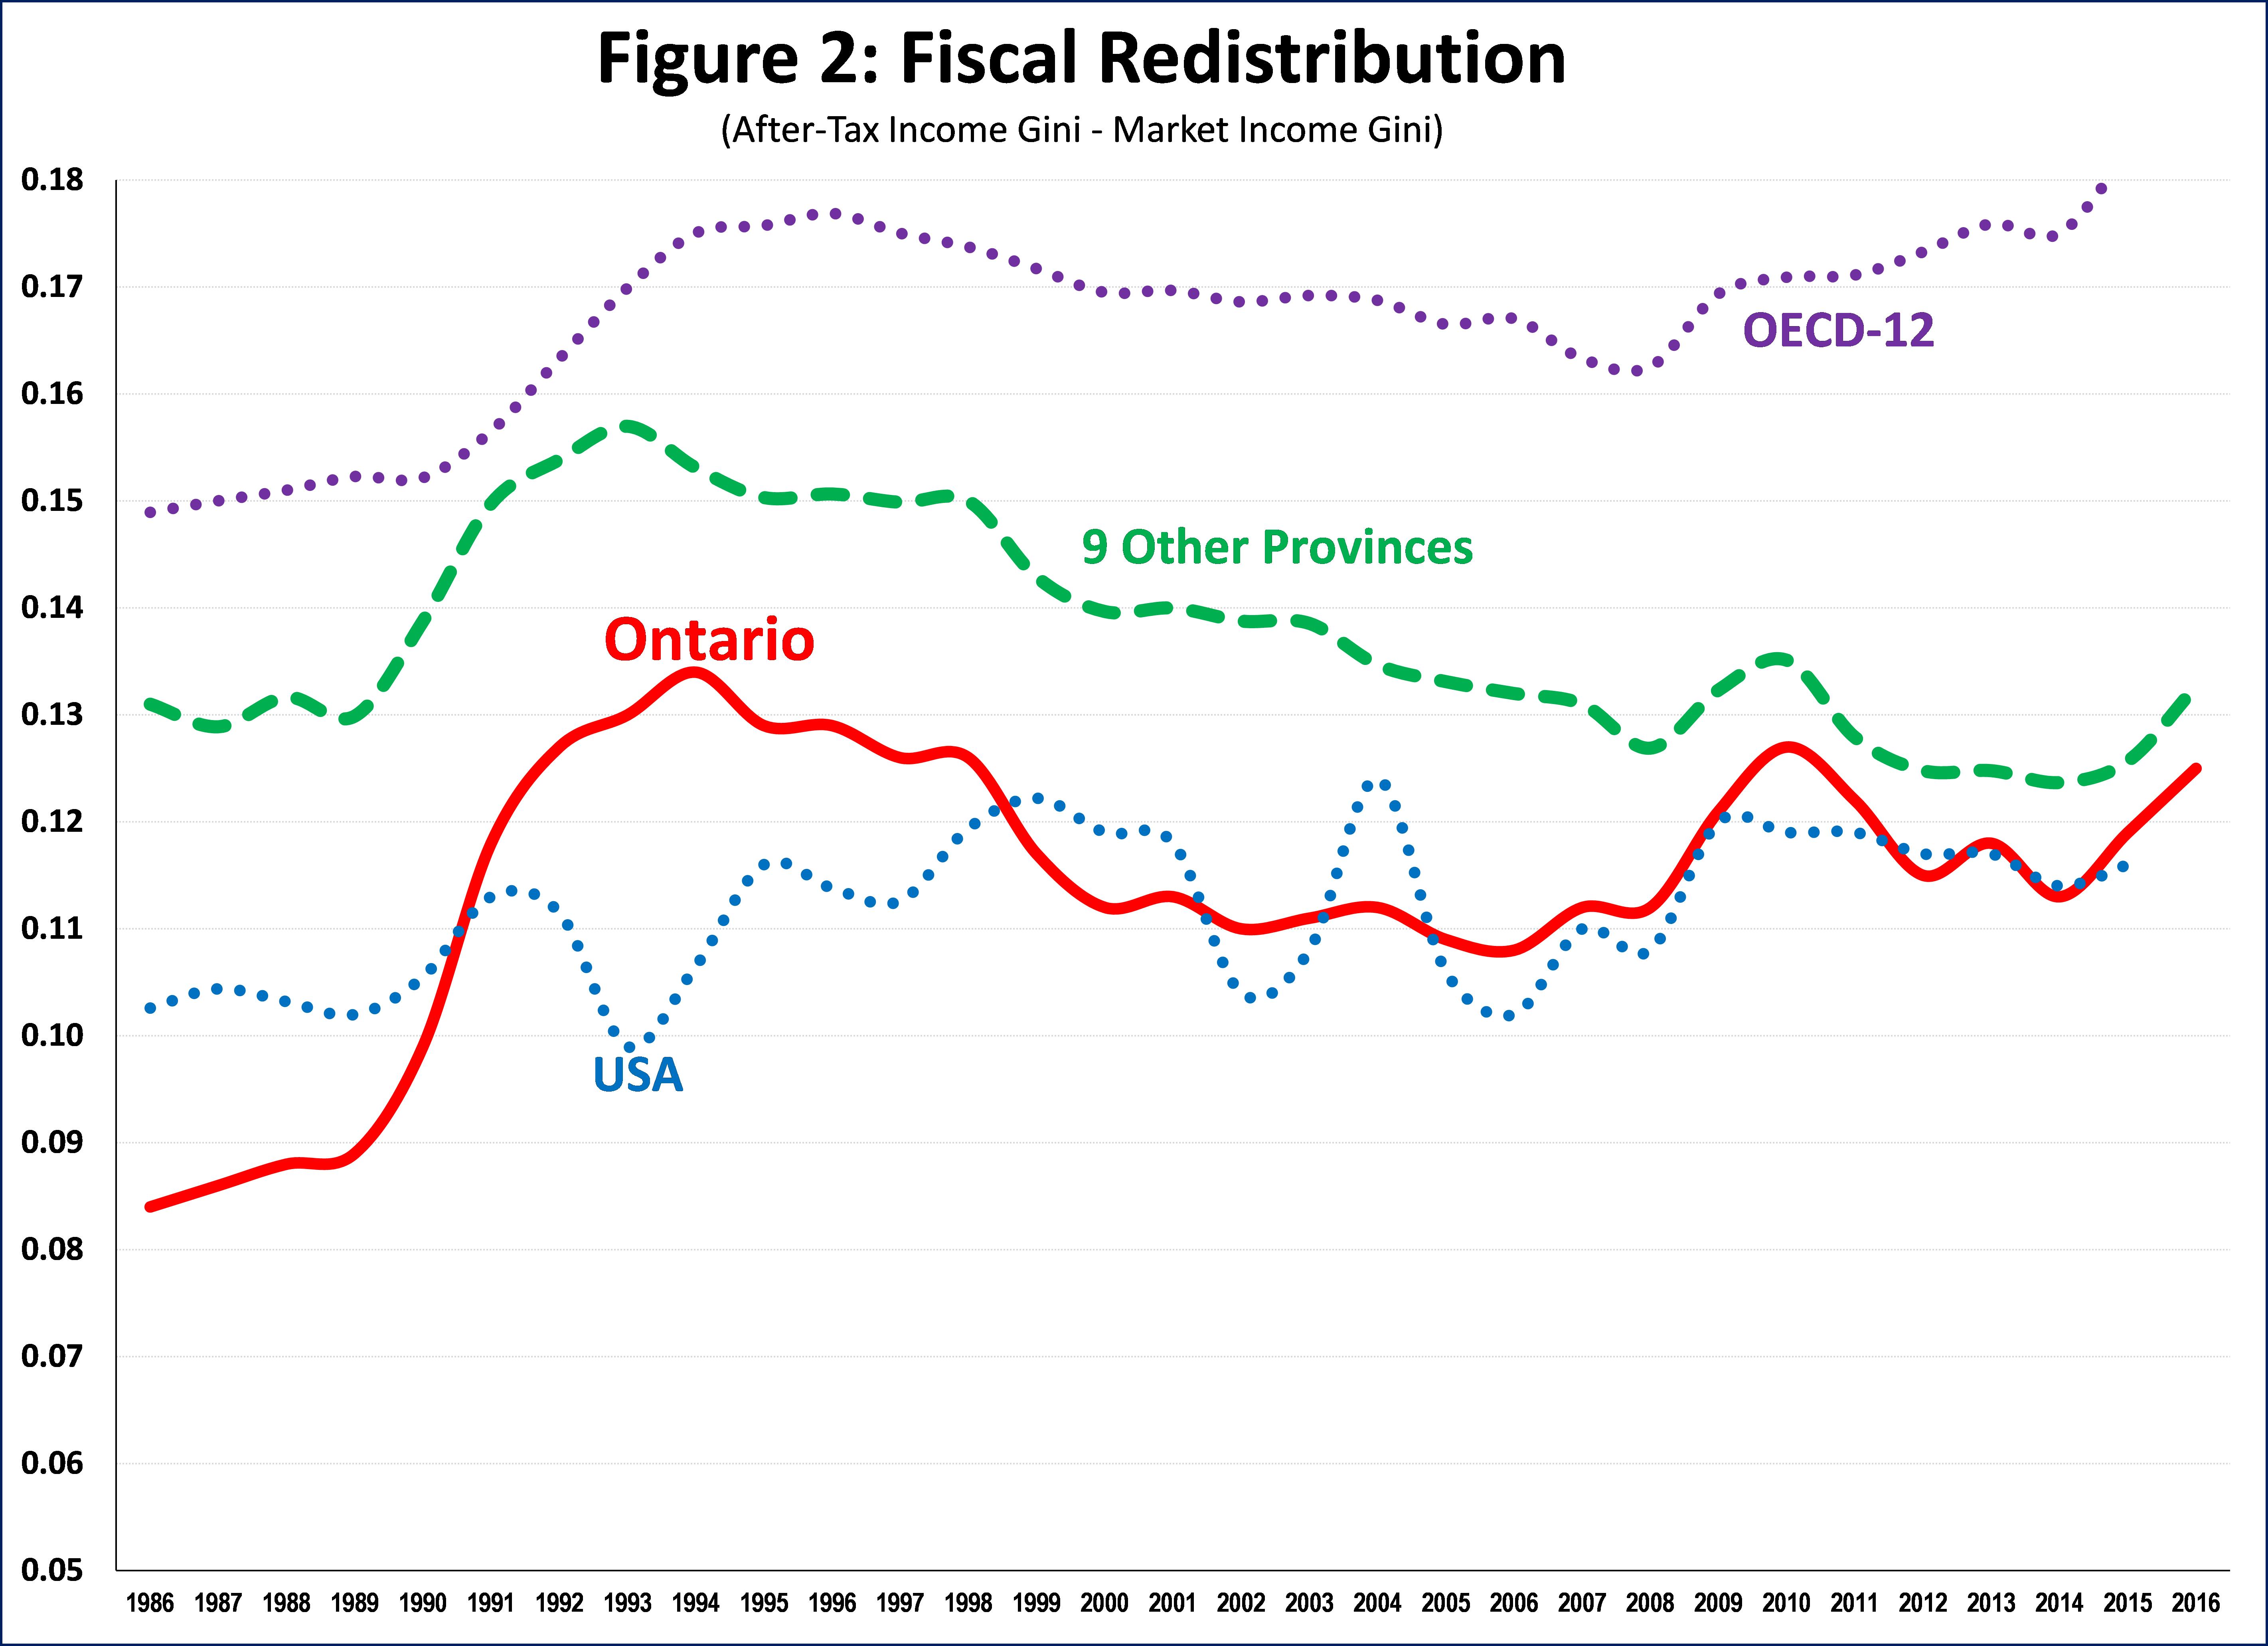
Fiscal redistribution varies significantly across time and jurisdictions. In an update to my OECD-related post I noted that Canada has historically had lower levels of Fiscal Redistribution than the OECD average. Figure 2 shows how Ontario compares to thee jurisdictions. To look at how Ontario compares to the rest of Canada, I include the average Fiscal Redistribution for the 9 Other Provinces. In tis regard Figure 2 shows that Ontario has traditionally had lower redistribution than other provinces. However, that gap has started to shrink in the last decade or so. The USA has traditionally had a relatively low and stable level of redistribution, which Ontario has tracked for about two decades. As discussed previously, Ontario (and Canada generally) start with a relatively much lower level of market income inequality relative to the USA. Ontario’s redistribution is significantly lower than the OECD-12 average (a sample of OECD Member-States).
Regression Analysis to Forecast Inequality in Ontario
My objective is to forecast the impact of the three fiscal plans on after-tax income inequality in Ontario because understanding inequality impacts should be a critical decision criteria in the election.
There are a number of challenges associated with this endeavour. First, as far as I am aware, there is no publicly-available model that calculates fiscal policy changes in Ontario. Perhaps the SPSD model developed by Statistics Canada comes closest, in this respect, in that it can estimate impacts of well-defined fiscal policy changes by income categories (such as the the so-called “middle-class personal income tax cut announced by the PC leader), but does not provide an inequality measure such as the Gini coefficient.
The second challenge is lack of specificity. As I noted in the CCPA article, the PC party has not released a comprehensive fiscal plan, but have been running on a set of ad-hoc announcements and general commitments, including to reduce program expenditures by about $6 billion dollars via “efficiencies”. Detailed models like the SPSD cannot be applied based on such broad generalities.
In the absence of alternatives, I develop a novel, regression-based model to predict the After-Tax income Gini coefficients for each fiscal plan. I do this by separately analyzing and forecasting Transfer Redistribution and Tax Redistribution and then subtracting them from the forecast Market Income Gini coefficient. Because this is a novel approach to an issue that has not been otherwise addressed during this or other elections in Canada, I provide my intermediate results for “peer review” purposes.
There are data challenges even with the regression approach. Ideally, I would want regress historical federal and provincial cash transfers against Transfer Redistribution and apply the results to forecast federal and provincial transfers to predict future Transfer Redistribution. However, while the amount of transfers could be calculated for the NDP and Liberal fiscal plans, that is not the case for the PCs because of lack of specificity. As an alternative, I use Program Expenditures (as a percentage of GDP) (“PE%GDP”) as a proxy for all the transfers (federal and provincial) that have an impact on the size of Transfer Redistribution. Figure 3 shows that PE%GDP has tracked Transfer Distribution very well over the last there decades in Ontario. The correlation coefficient is relatively high, as is the R2 and the regression results are significant.
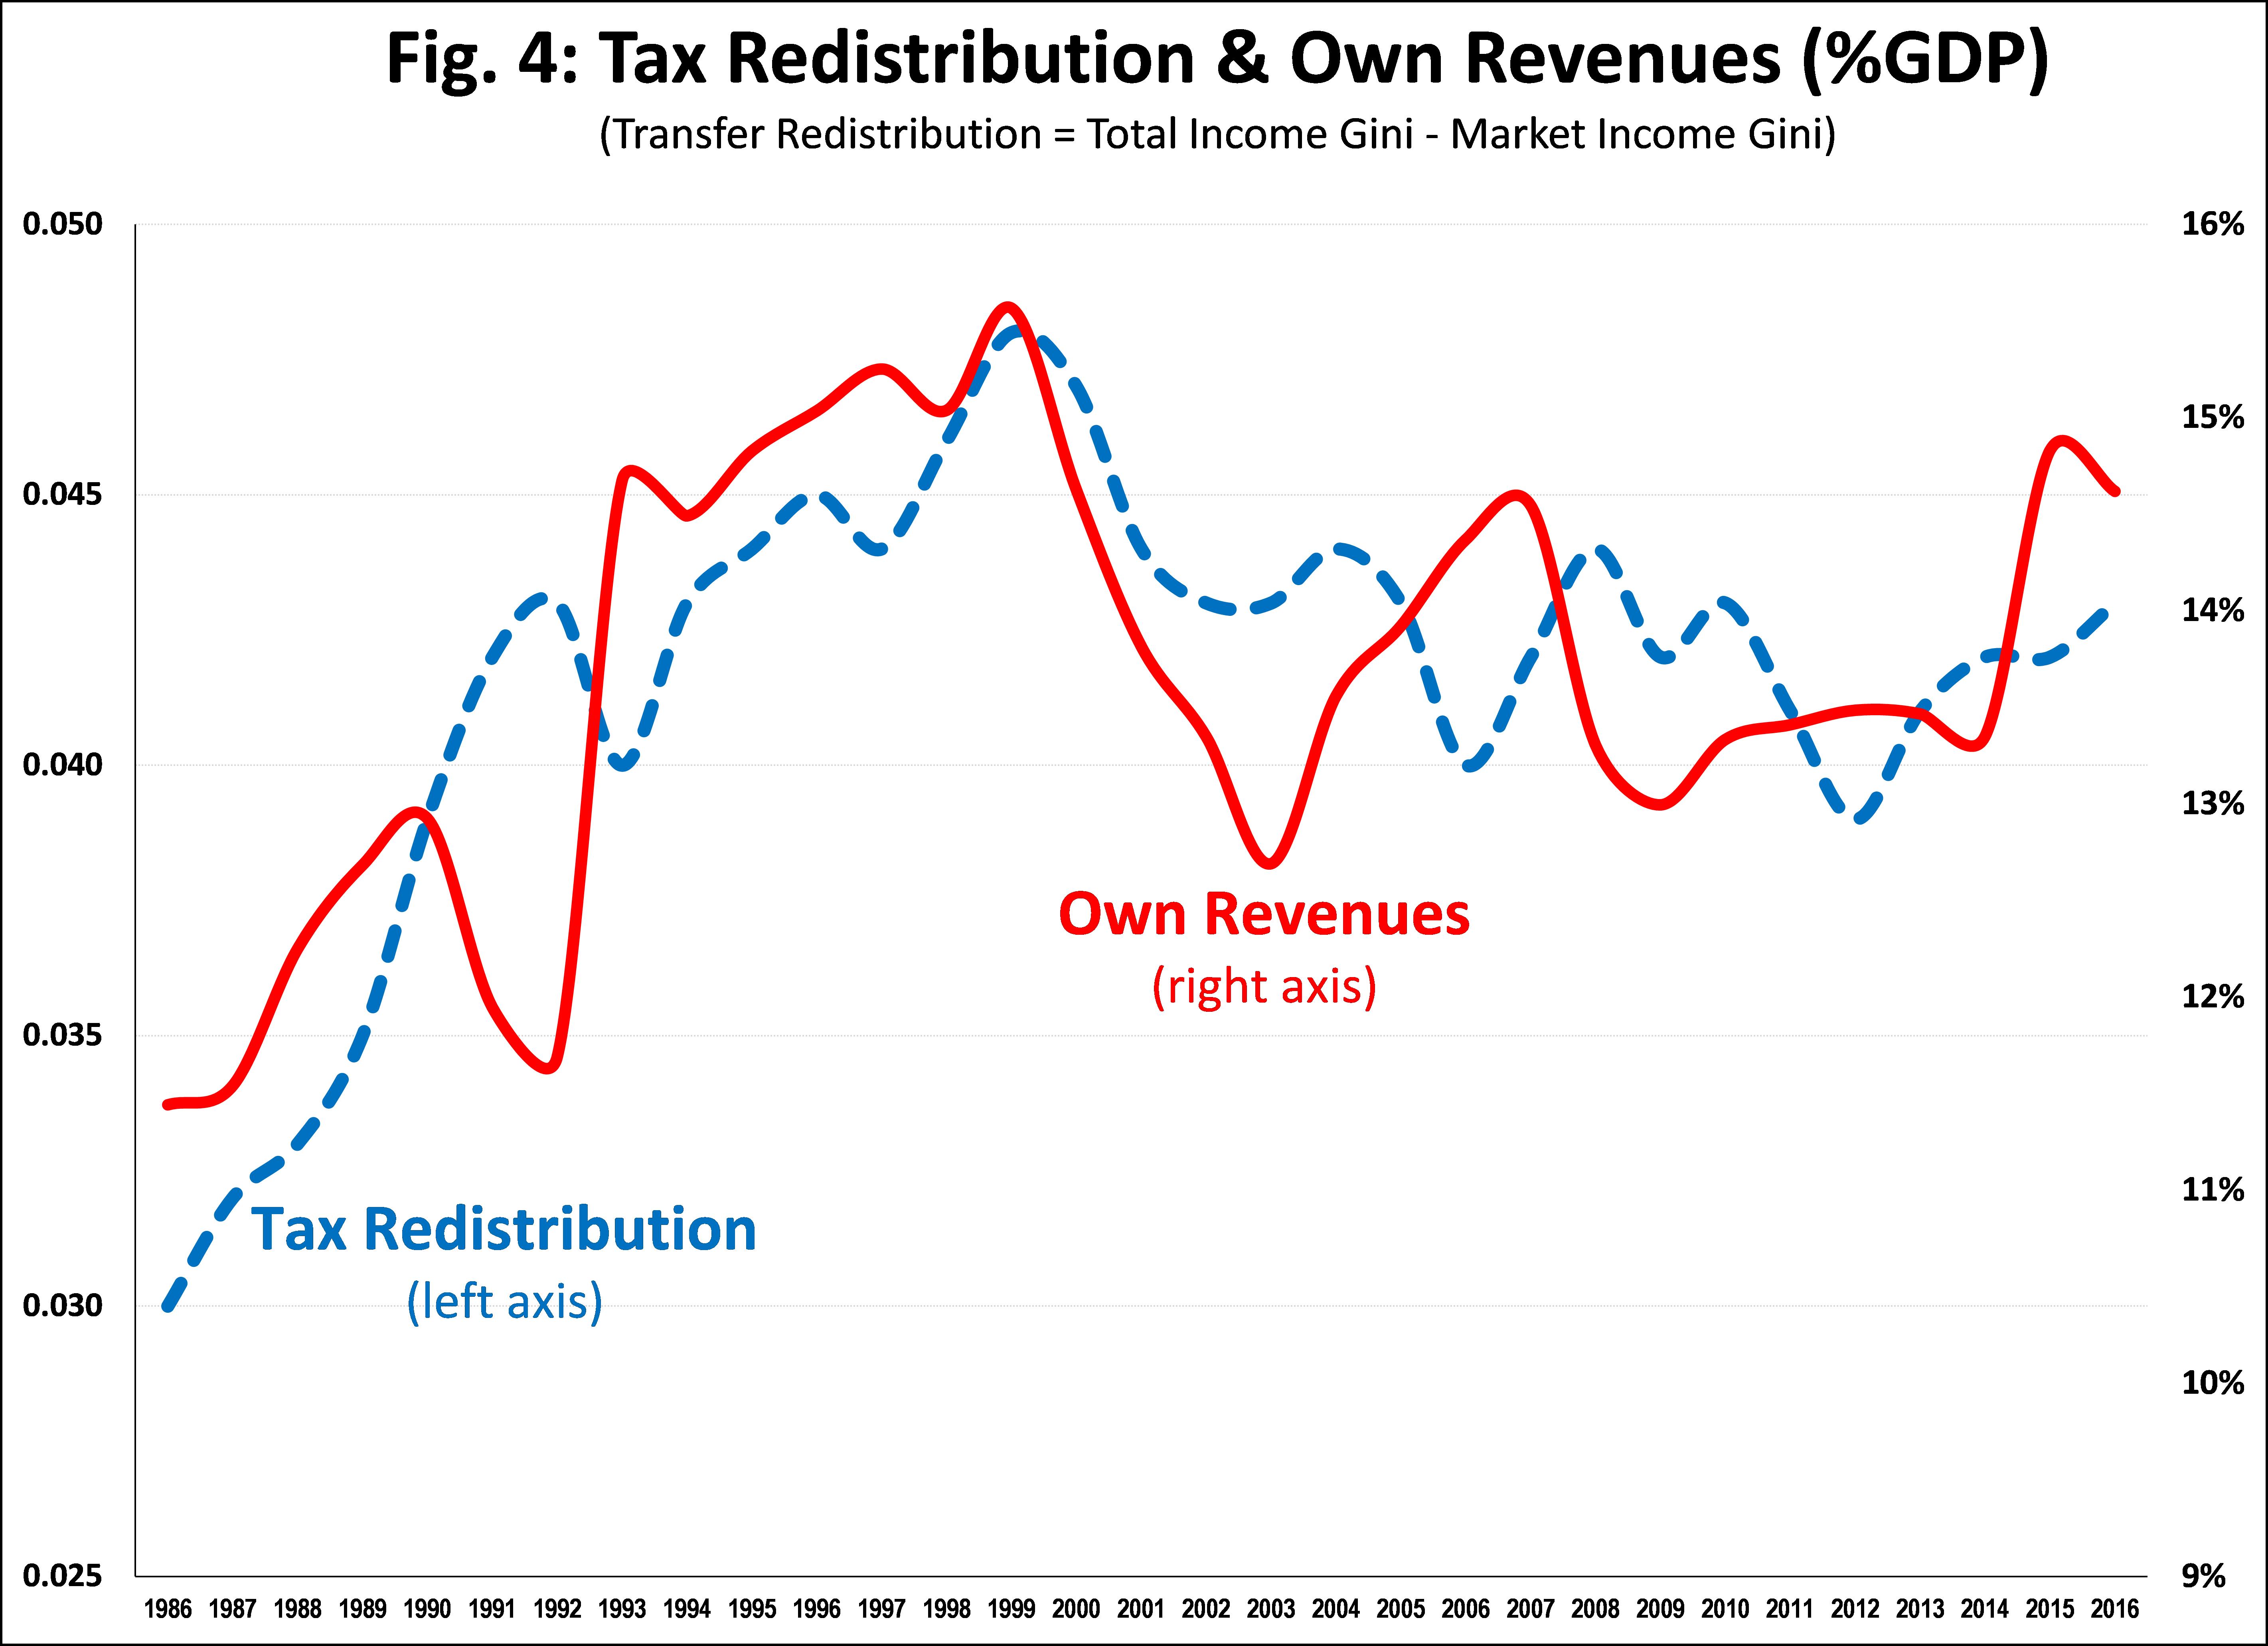
The same data constraints apply for Tax Redistribution. In this case, I use Own Revenues as a percent of GDP (“OR%GDP”) as a proxy for all taxes (federal and provincial) that have an impact on the size of Tax Redistribution. Figure 4 shows that OR%GDP has tracked Tax Redistribution relatively well over the last three decades. The correlation coefficient is moderate, as is the R@ and the regression results are significant.
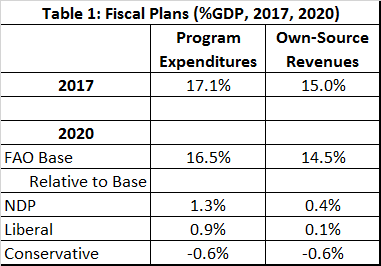
Table 1 includes the PE%GDP and OR%GDP for 2020 for the Base and three main political parties that I developed in the companion CCPA article. They show that relative to 2017 the NDP would increase PE%GDP and maintain OR%GDP, while the Liberals would increase PE%GDP and decrease OR%GDP and the PCs would decrease PE%GDP and OR%GDP.
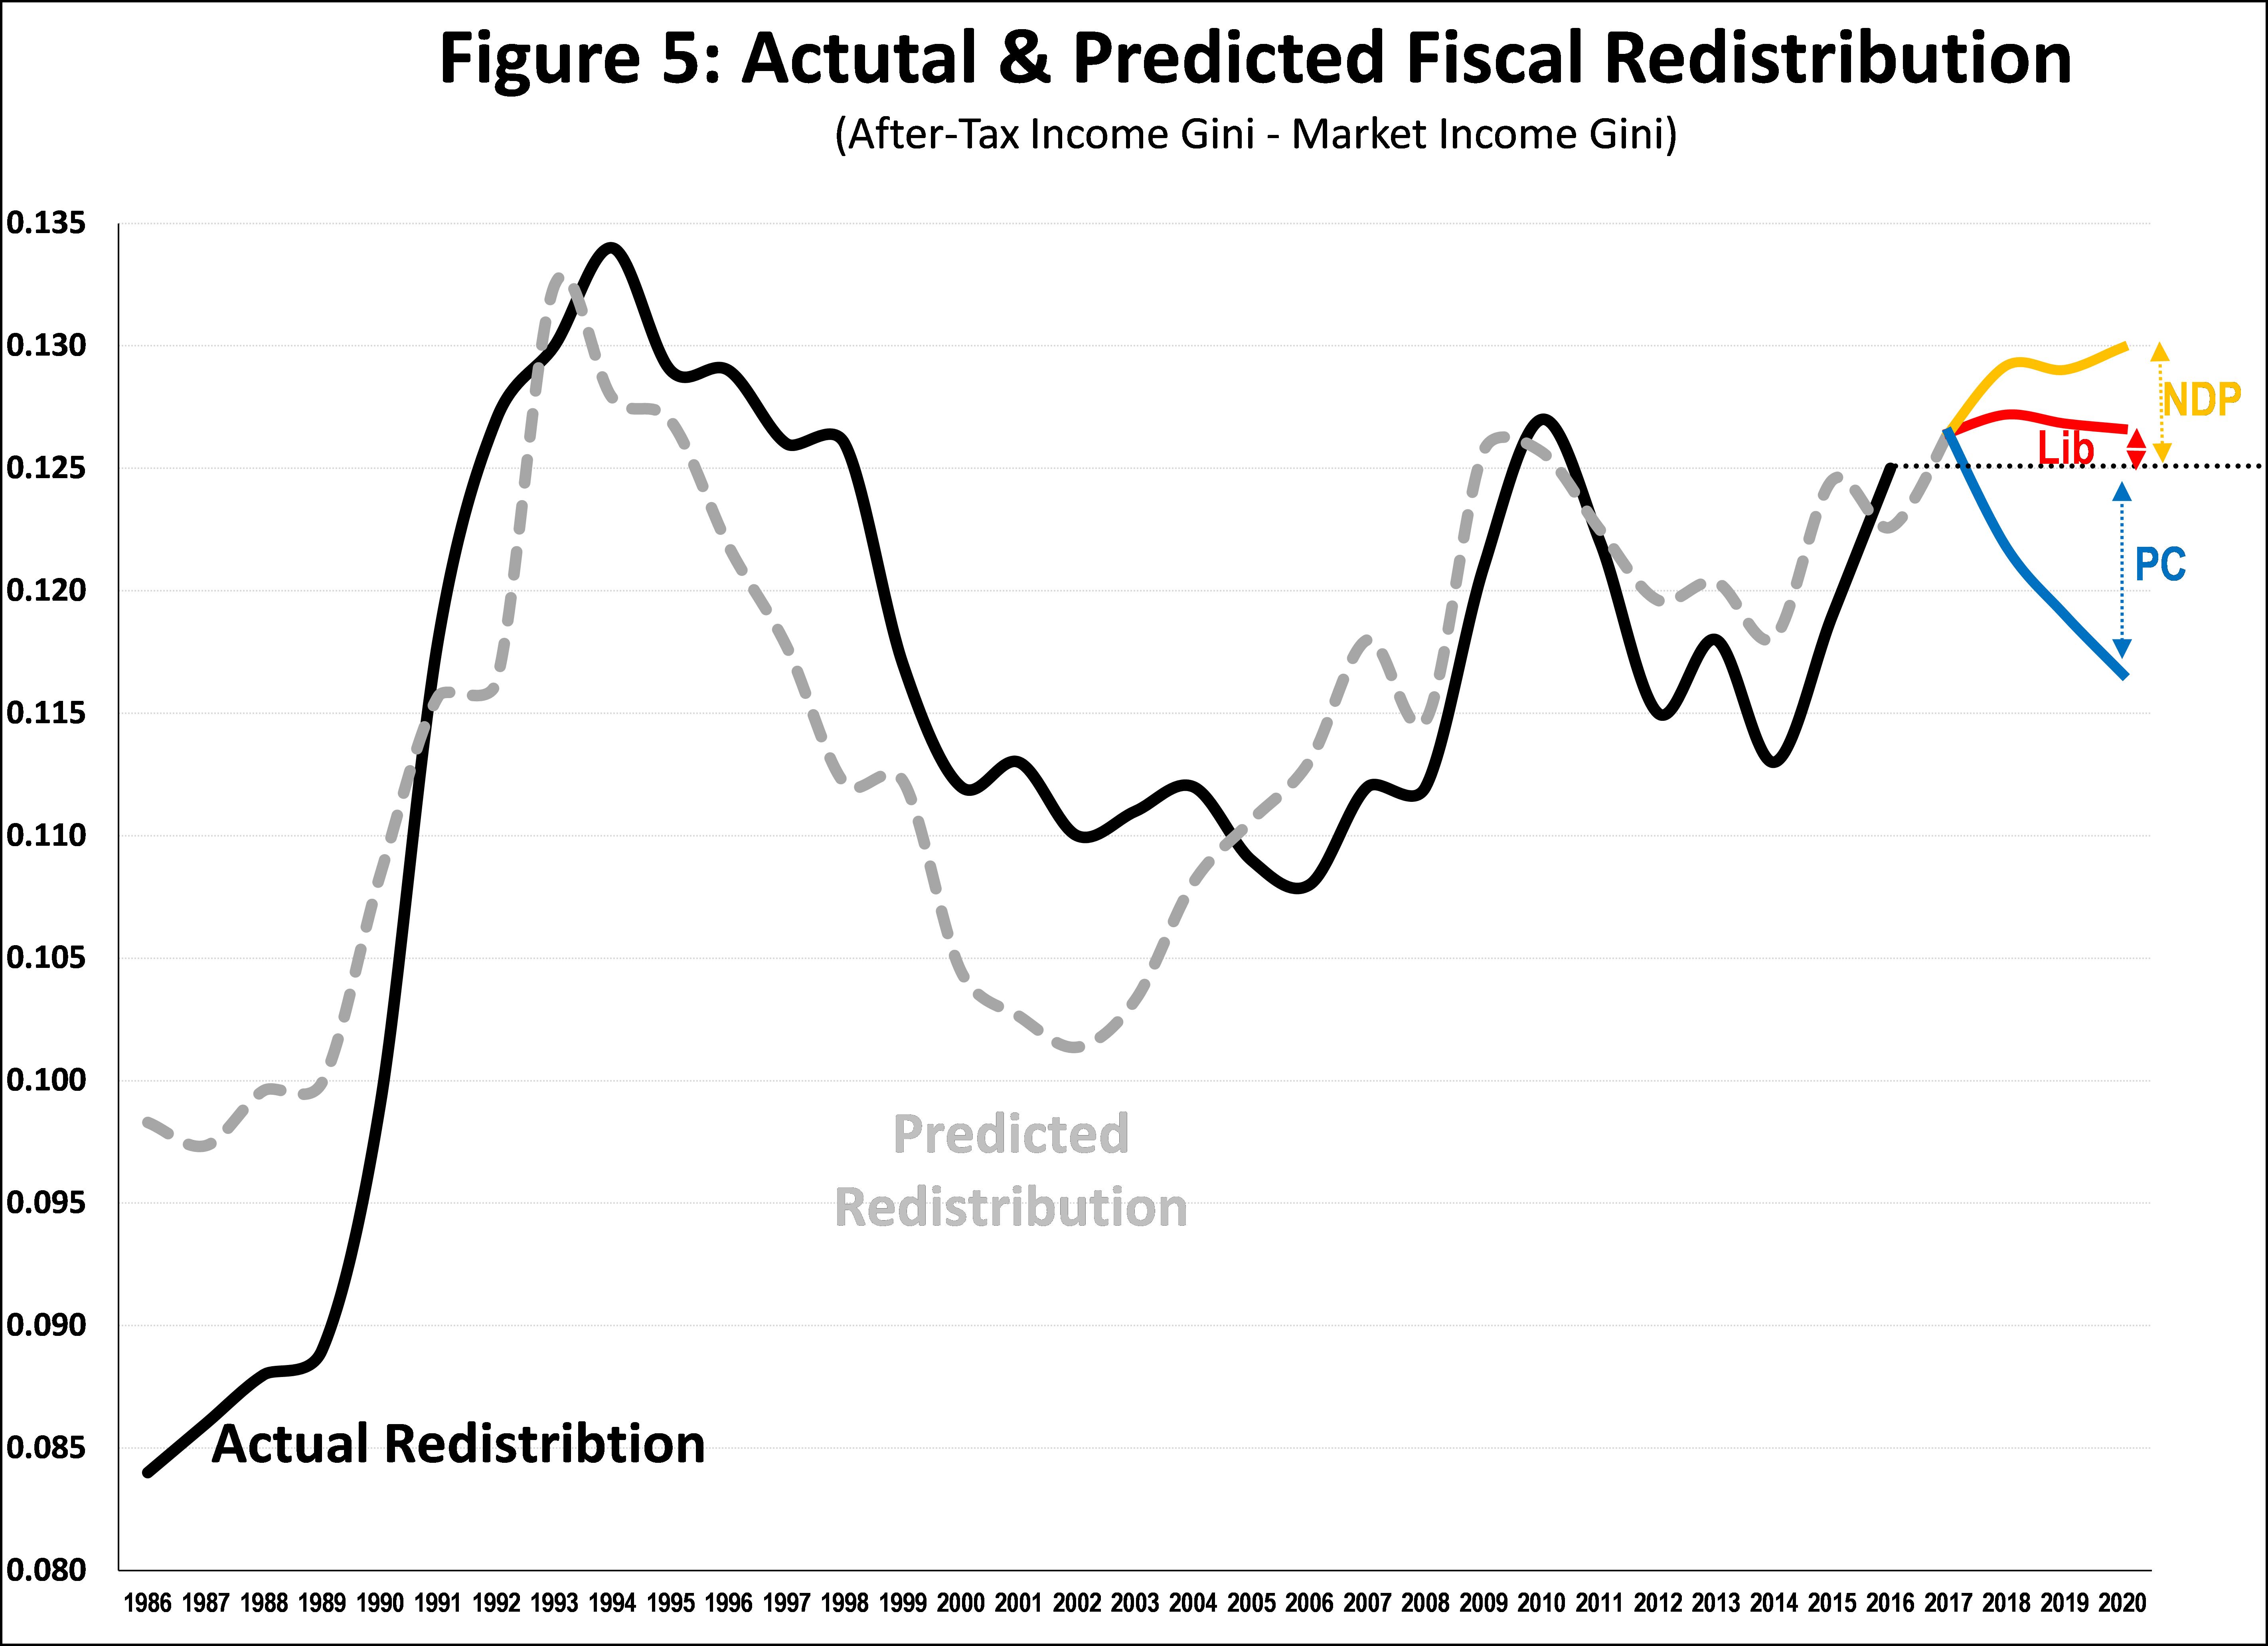
Applying these fiscal plans to the regression parameter values provides me predicted Fiscal Redistribution for each of the there main political parties, as presented in Figure 5. It shows that to 2016 (last available data from Statistics Canada), the NDP would increase the amount of redistribution, while the Liberals would increase it moderately and the PCs would decrease it significantly. Figure 5 also shows the predicted estimates for the historical period 1986-2016 and shows that predictive values tracked actual values relatively well over the period, especially over the latter period from 2008-2016. This provides me with some confidence that the parameter estimates are likely provide reasonable forecast estimates for the 2017-2020 period. Further, the scale of the forecast estimates are consistent with past experience.
Forecasting Inequality
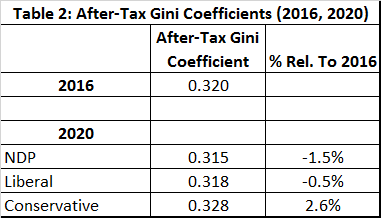
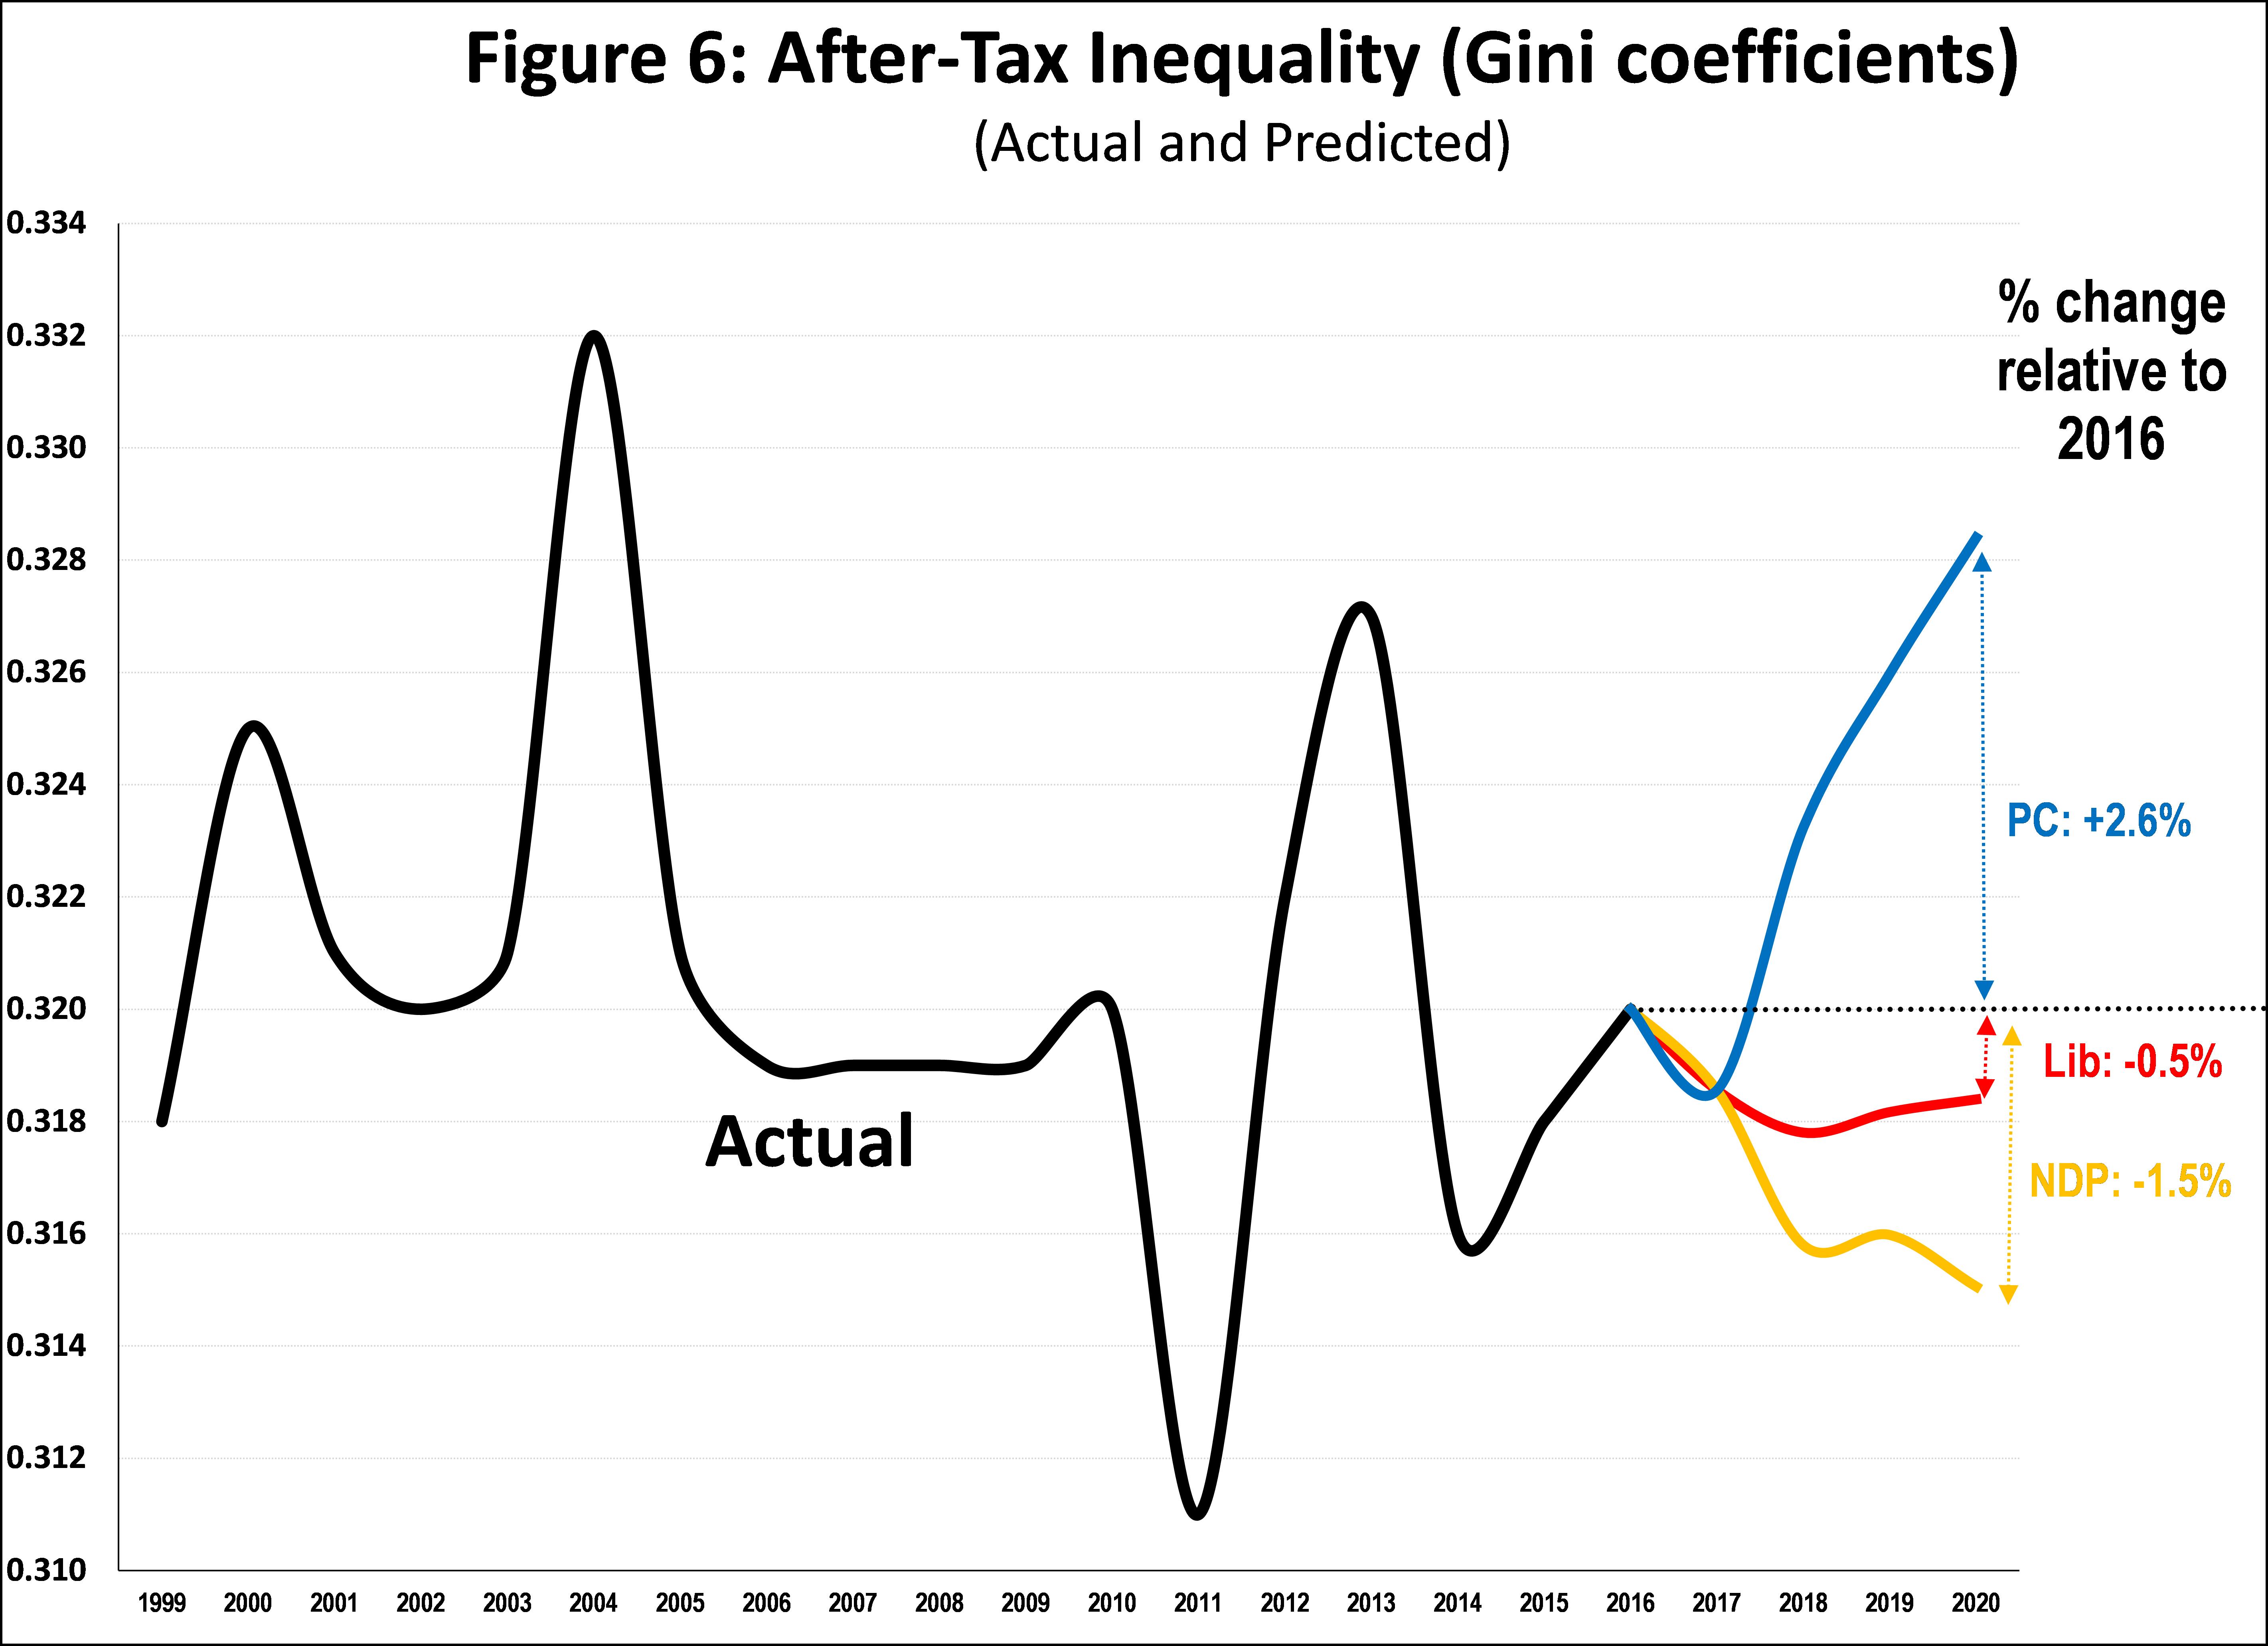
Based on trend analysis I forecast the Market Income Gini co-efficient to remain at the same level as 2016 (0.4450) for the 2017-2020 period. From this I subtract the predicted Fiscal Redistribution for each of the fiscal plans to calculate the After-Tax income Gini coefficients, presented in Table 2 and graphed in Figure 6.
These estimates indicate that the the NDPs’ fiscal plan would decrease the after-tax income Gini coefficient by about 1.5% relative to 2016. The Liberals would decrease it by 0.5%. The PCs’ reduction of program expenditures and own revenues would increase the after-tax income Gini coefficient by about 2.6%.
Concluding Thoughts
Based on my analysis of the fiscal plans of the three major political parties in my companion CCPA blog, in this post I developed a novel, regression-based impact model to estimate the likely impact on inequality of those plans. While the approach is novel, and there is a confidence interval around any point estimate, I am reasonably confident that I have forecast the direction and order-of-magnitude of the inequality impacts: the NDP would decrease after-tax income inequality moderately, the Liberals would decrease it slightly, and the PCs would increase it significantly. For any voter concerned about inequality, these findings provide the first available quantitative estimates of those impacts, thus allowing a broader economic discussion on fiscal plans to include equity and efficiency considerations.

