
Housing Affordability and Inequality: Low-Income Renters in Ontario
In this first of a series of housing-related posts I analyze rental housing expenditures for low-income households in Ontario. Rent is the single largest expenditure element for renters in the first and second household income quintiles and is therefore an important indicator of housing affordability and expenditure inequality. This is a relatively under-studied component of the overall housing market; most policy analysis in Ontario has focussed on ownership affordability. Rent-related data is comparatively less comprehensive and detailed than ownership-related data and hence an important aspect of this first post consists of data compilation, projections and analysis. In subsequent posts I discuss policy initiatives from the perspective of affordability and inequality for low-income renter households.
Distributional Analysis of Rent Expenditures
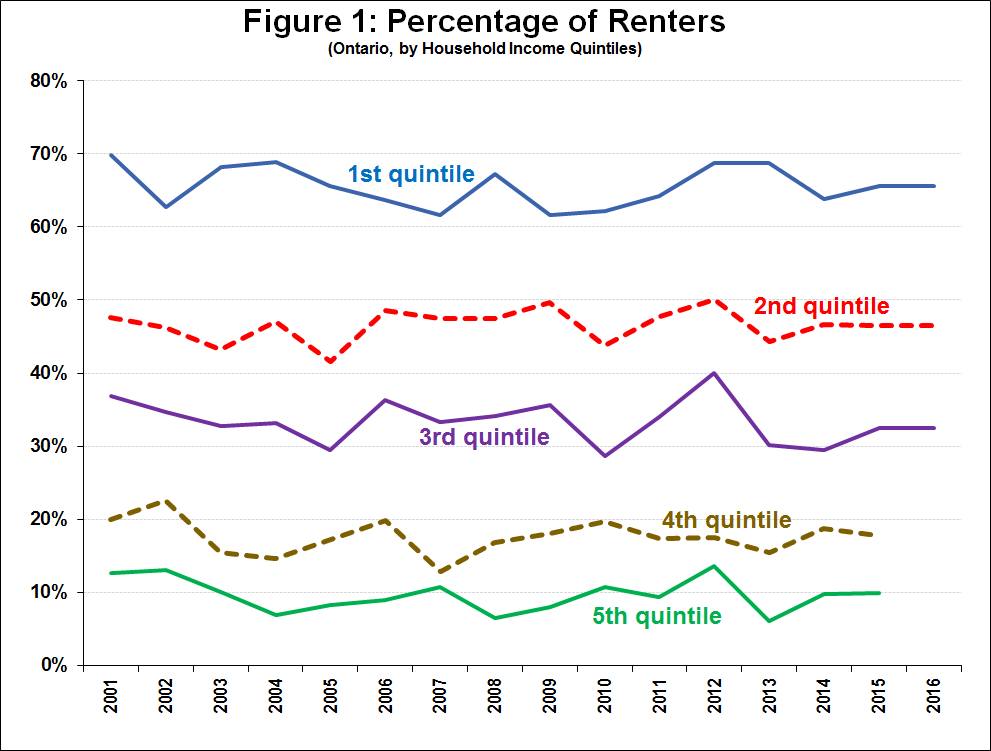
Renter-occupied housing accounts for about one third of all housing in Ontario, with the remaining two-thirds being owner-occupied (approximately evenly split between owners with and without mortgages). Based on Statistics Canada’s Survey on Household Survey (SHS), Figure 1 presents the percentage of renters across household income quintiles. Other than the yearly variation expected from such survey data, the trends are relatively stable, with about 66% rental households in the first quintile and 47% for the second quintile. Indeed, the first and second quintiles make up most (38% and 27%) of all renters in Ontario, with renters in the third, fourth and fifth quintiles together making up the remaining 35%. The stability of these renter/ownership trends over several economic cycles and the current upswing in the housing ownership prices indicates that the rental market is and will continue to be an important component of the overall housing market in Ontario.
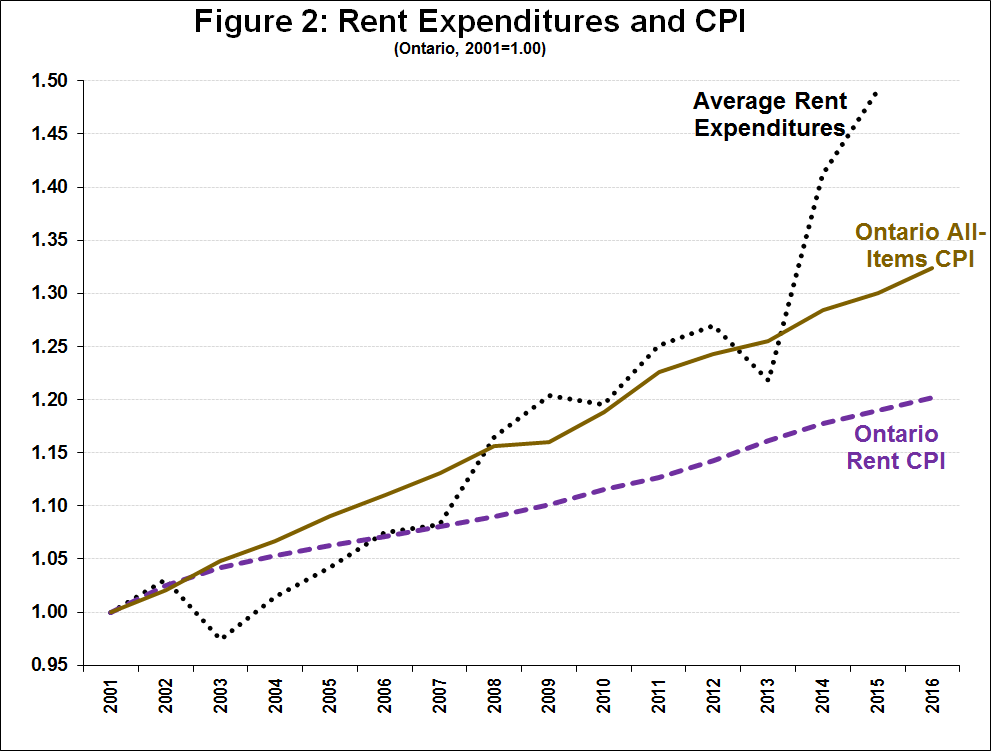
Average rent expenditures for all households increased from $651 to $971 per month over the 2001-15 period. Figure 2 presents that information in index form and compares it to the “All-Items” Ontario CPI and the Rent component of the Ontario CPI. Focussing on the 2001-15 period, Figure 2 shows that annual average rent expenditure increases (2.9%) were much larger than that of the All-Items (1.9%) and Rent Ontario CPIs (1.2%). The contrast between the 2.9% expenditures and 1.2% rent CPI is surprising and I will discuss this data issue in a subsequent post.
Focussing on rent expenditure by quintiles, Figure 3 shows expenditures for the first and second quintiles separately and the third, fourth and fifth quintiles combined. Shelter (rent) is an economic normal good and hence Figure 3 confirms that rent expenditures increase with income. In addition, the SHS methodology to calculate quintiles does not adjust for household size. Given this, household size tends to increase by quintile (1.55 persons in the first quintile, 3.50 for the fifth quintile, etc.), and therefore holding everything else constant, we would expect larger households to spend more on shelter than smaller households. Average annual rent expenditures increased 3.5%, 2.2% and 3.0% for the above-noted quintiles. It is concerning that the first quintile had the largest annual increases. Note that the first quintile observation for 2013 appears to be an off-trend statistical aberration. Regardless, the trend is clear and shows that this type of disproportionate impact on the lowest-income households decreases housing affordability that can result in greater in overcrowding and homelessness.

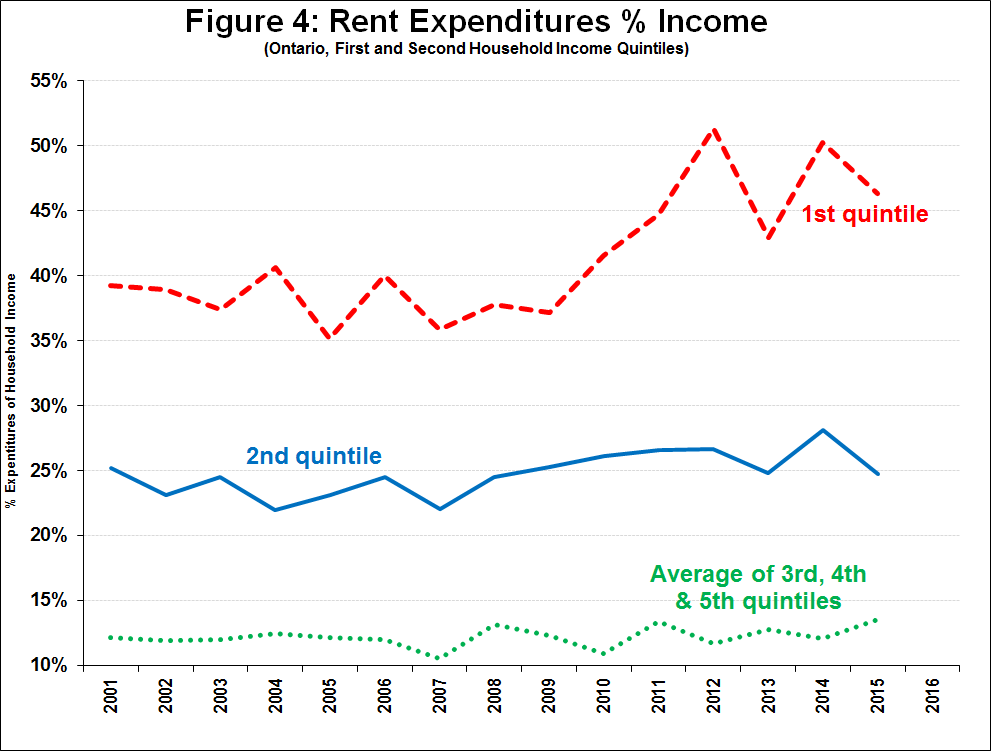
Figure 4 presents rent expenditures as a percentage of the respective household incomes and shows an increase in expenditure inequality, with first quntile households spending a larger and increasing proportion of their income. A data caveat – the quintile income is an average for all quintile households, and will not be the same as for the renters in that quintile. Even taking this data caveat into this account, the trends are clear: while income for the combined third, fourth and fifth quintiles and the second quintile have kept up with respective rent expenditures, first quintile incomes have not. This has resulted in the percentage of first quintile income expended on rent increasing 1.2% per year (the difference between rent expenditure (3.5%) and income increases (2.3%)).
Rental Dynamics in Ontario: Quantities and Prices
Conceptually, rental markets may be divided into two main categories, the primary rental market and the secondary market. The primary market consists of privately-initiated purpose-built rental buildings. The secondary market is made up of condominium rentals, subsidized rentals (e.g. public, social and co-op housing, and private rentals subject to subsidy arrangements), and “Other” rentals (include rental units in small buildings, secondary/accessory (e.g. basement) suites, houses and townhouses, etc.).
Figure 5 provides estimates of the number of units for each rental category for the 2007-16 period. Primary rental data are available from Canada Mortgage and Housing Corporation (CMHC) and are considered relatively comprehensive. CMHC data for condominium rentals and “Other” rentals are available for certain larger metropolitan areas starting in 2007 (hence the start date of Figure 5). I adjusted the more limited earlier period data based on broader later period coverage. There are no Government statistics for subsidized rentals and therefore I use the same 2011 point estimate of 265,000 units provided by the Ontario Non-Profit Housing Association (ONHPA) for the period in question (based on discussions with the author of the ONHPA report, Greg Suttor at the Wellesley Institute and that Toronto-area subsidized rental units (see below) have also been static). Lastly, I include a new category, “Informal” rentals, which is designed to capture the residual difference between Statistics Canada’s number of renter households and the total number of CMHC and subsidized rental units (a known data issue). Conceptually, these residual units include certain types of private-market rental arrangements not included in CMHC data (e.g. rooming houses and other forms of shared accommodation), and rental units that are not captured by CMHC data due to under-reporting (e.g. unregistered (“illegal”) basement suites, etc.).
Over the 2007-16 period the number of renter households in Ontario increased at an annual rate of 1.6%. That is about 24,000 net new renter households per year. Figure 5 shows that while primary rentals is the largest rental category, it has been increasing very modestly, only adding about 1,600 net new units per year, confirming that private purpose-built rentals is not keeping up with underlying demand. Condominium rentals has taken up much of the slack, adding about 10,000 net new units per year. This growth reflects a larger universe of condominium apartments and a higher ratio of rentals (currently about a third) within that universe. “Other” rentals and subsidized rentals have been stable over the period. “Informal” rentals is the second largest component and have increased by about 13,000 per year.
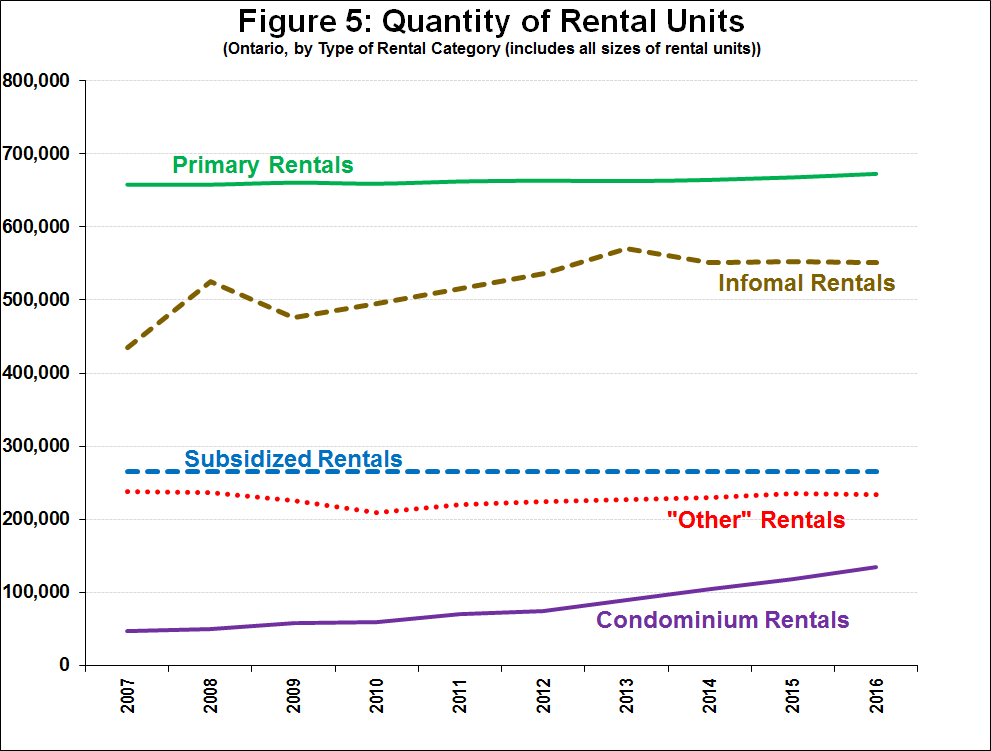
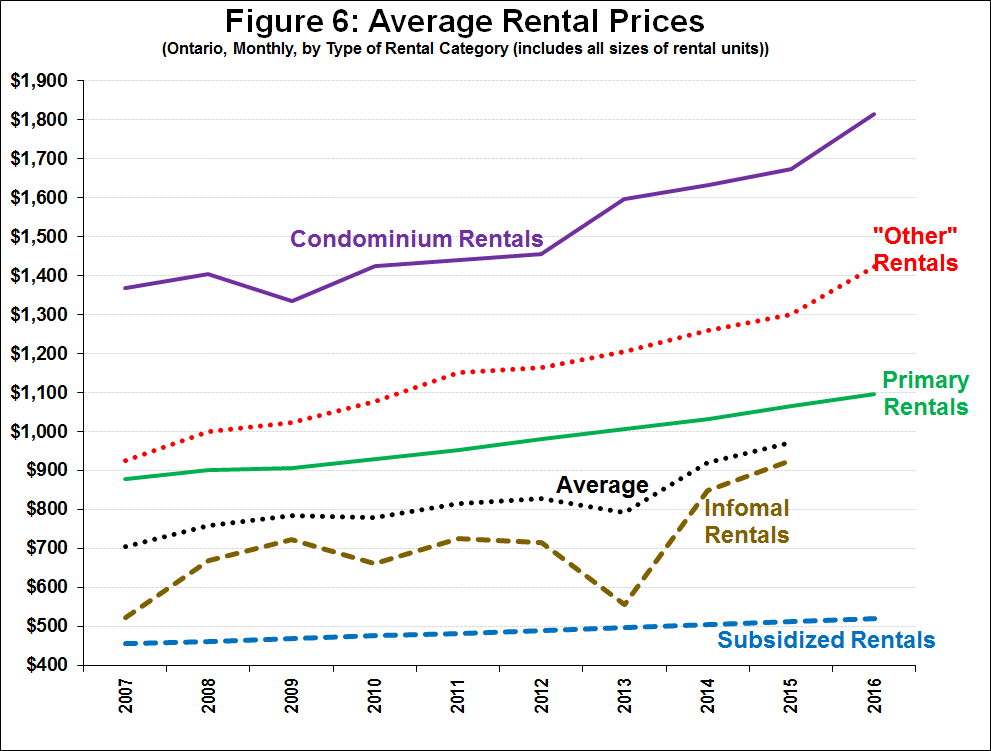
Figure 6 provides estimates of the average monthly rental price for each category. Following from the data discussion above, primary rental prices are from CMHC and I adjusted available CMHC price data for condominium rentals and “Other” rentals. For subsidized rentals I used the average rental price for Toronto Community Housing Corporation (TCHC), which is the municipal social housing provider in Toronto. It has just under 60,000 units and accounts for more than one fifth of all subsidized rentals in Ontario. Broadly-speaking there are two types of rent arrangements in subsidized rentals. The most common (accounting for about 200,000 of the 265,000 units in Ontario (75%)) is referred to a “rent-geared-to income” (RGI) because the eligible household pays 30% of their income, independent of their income. The other category is often referred to as “affordable” rent and is any arrangement (e.g. rent supplements, “affordable” units, etc.) that due to some form of initial or ongoing subsidy that results in below currently-comparable private market rates. Based on TCHC rental revenues and quantities I calculated the RGI and “affordable” rents ($357 and $1,022 for 2016) and applied the respective RGI/affordable ratio to calculate the average Ontario subsidized rental rents for the 2007-16 period ($520 for 2016). As above, I calculated the “Informal” rentals price residually.
Figure 6 shows that there are significant difference in the level of average rental prices. Condominium rentals have the highest average, at around $1,800 in 2016. In contrast, subsidized rentals averaged $520 in 2016. Primary rentals average about $1,100. The “Other” rentals are relatively high because of over-weighting of houses and other relatively expensive units. The “Informal” rental price is between subsidized rentals and the average, which is consistent with my expectations (given that it captures shared accommodation, unregistered suites, etc.). The dip in price in 2013 is due to the data aberration I noted previously. The rate of rent increase for each of the categories varies significantly, based on the level of rent-regulation: subsidized rentals increased 1.5% annually (consistent with the first quintile income growth of 1.3%); primary rentals (most of which are rent-regulated based on provincial legislation) increased 2.5% annually; and condominium, “Other” and “Informal” rentals (which tend to be lightly or not regulated) increased 3.2%, 4.9% and 7.4% per year, respectively.
Concluding Thoughts
Annual rent expenditures increased 4.6% per year for first quintile renter households over the 2007-15 period, increasing from $550 to $789/month. These increases far exceeded annual increases in income (1.3%) which resulted in such households having to expend an increasing share of their income on rent. This decrease in affordability is likely responsible for increased over-crowding and homelessness, and has resulted in greater expenditure inequality.
CMHC data shows that first quintile households accounted for about 185,000 of subsidized rentals. This is a minority of first quintile households, however. In the face of static number of subsidized rentals, as the number of first quintile household increase over time, more households have increasingly been forced to access the more expensive and faster price increasing private market. For instance, in 2007 about 410,000 first quintile households were in the unsubsidized market, a figure that has grown to 520,000 in 2016 (an increase of about 12,000 per year). It is this non-voluntary change in supply-mix that explains the disproportionately large first quintile rent expenditures. Unsurprisingly, the waiting list for RGI housing in Ontario has correspondingly increased from 124,000 to 171,000 over the same period.
This dire situation will continue to deteriorate. In subsequent blogs I will discuss policy initiatives from the perspective of affordability and inequality for low-income households.
Thanks so much for this, Edgardo, looking forward to the follow-up posts!