
Collective Bargaining and Poverty Reduction: OECD Data
My union Unifor is currently undertaking an important “Rights at Work” campaign, which involves a national tour of meetings with our officers and local leaders and stewards, followed by a membership canvass and community outreach effort, all aimed at beating back the current attack on fundamental labour rights coming from conservatives at all levels in Canada. So far the campaign has had a very strong reception. Ontario will be a key battleground, of course, since the future of the Rand Formula will be decided in the next election (as early as this spring), but similar attacks on labour rights are being experienced at the federal level and in many other provinces.
A key argument in winning this battle will be showing how important unions and collective bargaining are to the health of broader society. This helps to defeat conservative attempts to portray organized labour as self-interested and removed from the overall workforce. In our materials and presentations we have been marshalling arguments to show that unions lift up wages, standards, and security for all workers, not just their own members, through their influence on the actions of non-union employers, their influence on policy and politics, and their ability to provide a collective voice for workers’ interests on all issues.
The powerpoint show we are presenting on our leadership tour makes many of these arguments. In our internal dress rehearsals, however, my colleague Jordan Brennan suggested that a graph comparing poverty or inequality rates across countries, and linking those differences to unionization, might help tell the story. He was right, and we included a simple scatter plot in our show, which has consequently generated many inquiries. So I will use this blog entry to describe the data more fully and formally, and consider its implications.
I used bargaining coverage rather than union membership to capture the fact that in many countries, institutional arrangements (such as works councils, sectoral agreements, tripartite structures, etc.) allow unions to extend their influence over both workplace and social trends more than their formal membership would otherwise ensure. The OECD maintains estimates of bargaining coverage based on country-level studies. They are not included in the OECD’s formal system of databases, but are reported semi-regularly in various reports. The most recent publication of this series is from their Economic Policy Reform 2013 publication (Figure 14.3.1, also available on-line at http://dx.doi.org/10.1787/888932778404 if you have access to the OECD library). It reports approximate bargaining coverage for the most recent available year (ranging considerably from 2009 or 2008 for most countries, to as far back as 2006 for a few).
For a measure of inequality I chose the OECD’s standard relative poverty index: the share of the population receiving income (after tax, after transfers) less than half of the median. Again, this data is for the most recent year (2010 in most cases), and is available directly from the OECD’s on-line Income Distribution database.
The following figure illustrates the broad negative correlation between bargaining coverage and poverty: that is, the higher is bargaining coverage, the lower is relative poverty (and the more equal is income distribution). (It differs slightly from the simple scatter plot in the Unifor powerpoint show because I have obtained one more update of each of the series.) Low-unionization high-poverty countries are grouped tightly in the top left (including Mexico, the U.S., Turkey, Japan, and Korea). High-unionization low-poverty countries are grouped tightly in the bottom right (including several countries in continental Europe and Scandinavia with near-universal bargaining coverage). The rest of the OECD countries form a broad cloud between those two poles, with much variation but still a clear negative correlation.
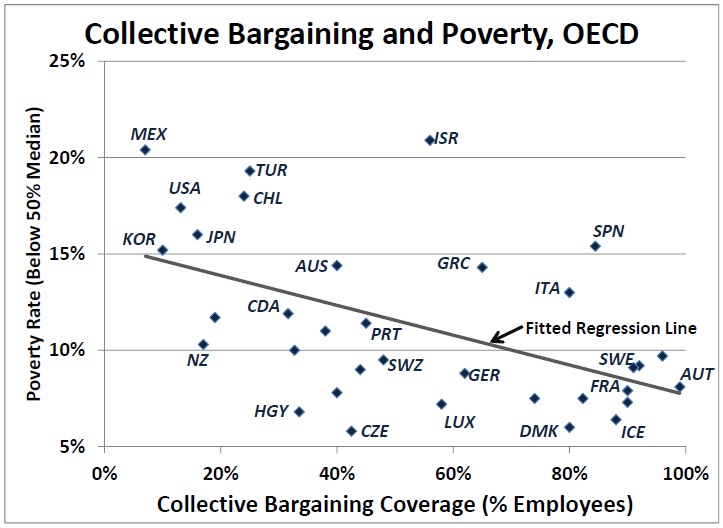
We can test the correlation more formally by performing a linear regression of this poverty measure on bargaining coverage. This confirms a strongly significant (at the 1% level) role for bargaining coverage in explaining poverty across countries. (The coefficient on the coverage variable is about -.08, implying that a 10% increase in bargaining coverage is typically associated with a 0.8% decline in the incidence of relative poverty. The t-statistic on the bargaining coefficient is -3.4.) The regression explains 27% of the international variation in poverty.
Not every country fits the trend, of course, for the obvious reason that there are many other determinants of income distribution in addition to unions and collective bargaining. The Mediterranean countries (especially Greece and Spain) have higher poverty than their strong coverage rates would otherwise imply — made worse, no doubt, by the severe consequences of forced austerity. Several Eastern European countries (Czech Republic, Hungary, and the Slovak Republic) have lower relative poverty rates than would be implied by their unionization levels, perhaps reflecting the continuing effect of socialist distributional norms there. (In Estonia, on the other hand, unionization is low and poverty is high, so this effect is not universal in Eastern Europe.)
The greatest outlier on the plot is Israel, which has the highest relative poverty in the OECD, yet (as of 2006, the most recent data reported) has relatively widespread collective bargaining (covering over half the workforce, reflecting Israel’s strong union tradition). Israel is a special case for many reasons (including military conflict, inequality between the Jewish and Arab populations, and the importance of immigration). If it is excluded, the explanatory power of the regression improves to almost one-third, and the coefficient on the bargaining variable increases slightly.
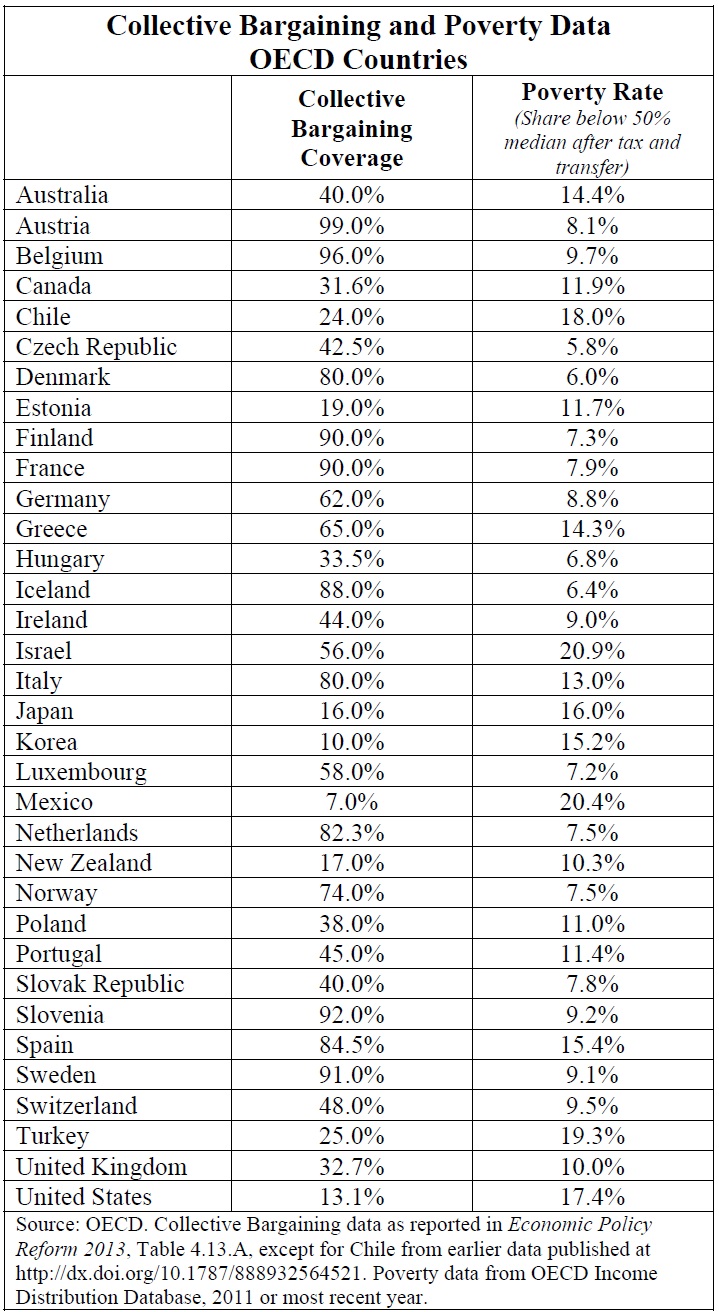
The following table provides the complete set of data used for the scatter plot and the regression.
Despite the limitations of the OECD data, therefore, and the richness of international experience regarding the determinants of inequality, I think it is reasonable on this basis to make the following conclusion:Â Collective bargaining (rooted in unions and labour law) has a very important impact in reducing inequality and relative poverty. Differences in collective bargaining coverage explain about one-third of the differences in relative poverty across most of the industrialized world.
did you catch catherine swift of the right wing persuasion on CBC noon hour yesterday?? she was positively salivating over the prospect of bring down public sector unions! she says she is an economist and no doubt she is, but so are you Jim and this union busting “right to work” crap has to be fought. facts and figures should win the day but there are lot of ignorant people out there!! keep up the good work and keep us really informed!
great work Jimbo
If you have the time and inclination it would be useful to plot the link between union density and the incidence of low paid work. The impact on poverty arises from labour market effects of bargaining, plus political action by labour, and it would be interesting to separate them out. best