
Income Inequality and Redistribution in Venezuela
I had been waiting for last month’s publication of the book “Confronting Inequality” before preparing my annual update on income inequality and redistribution in Canada. I am glad I did because the book presents new and exciting empirical findings that shed light on the age-old equity/growth debate (more on that below), but also introduced me to the Standardized World Income Inequality Database (SWIID). Data comparability and granularity has been a challenge for inequality researchers looking at countries outside the OECD and EU. Specifically, the lack of inequality data for market income did not allow researchers to measure and analyze the redistributive effect of Government policy. In contrast, the most recent version of SWIID provides historical estimates of Gini coefficients for disposable and market income for 192 countries generally to 2016. Keen to make use of this new database, I’ve decided to turn my attention south to my birth continent of Latin America and focus on Venezuela.
There is of course much to be analyzed (and debated) about and in Venezuela from a foreign policy/intervention, constitutional legitimacy, humanitarian, political and economic perspective. My objective here is narrow: to present evidence-based analysis of Venezuela’s income inequality performance, from a historical (1990 to 2015) and comparative (other Latin American countries) perspective. I use the same framework of analysis as in previous posts and encourage interested readers to refer to these for further conceptual and technical background. The most recent SWIID data for Venezuela is 2015 and therefore my analysis does not cover the current period of deep economic contraction or hyperinflation, although in the Epilogue I do hypothesize how these severe macro-economic shocks have likely impacted income inequality.
Market Income Inequality
Figure 1 presents market income Gini coefficients for Venezuela, four other selected countries in Latin America and two group averages: the “LatAm-17” group – Argentina, Bolivia, Brazil, Chile, Colombia, Costa Rica, Ecuador, El Salvador, Guatemala, Honduras, Mexico, Nicaragua, Panama, Paraguay, Peru, Uruguay and Venezuela – and the “OECD-14” group – Australia, Canada, Denmark, Finland, France, Germany, Italy, Japan, Netherlands, New Zealand, Norway, Sweden, UK and USA.
The data for the OECD-14 is from the OECD’s Income Distribution Database and generally available to 2015 or 2016 and is reasonably comparable to the SWIID data methodology used for the LatAm-17 group. The Gini coefficient varies from 0 to 1.00, with higher values representing higher inequality. Market income Gini coefficients measure the distribution of market income (from employment and investments), before any taxes or Government cash benefits.

Starting the analysis at the group averages, Figure 1 shows that market inequality was significantly higher (0.07 Gini points) in Latin America than in the OECD at the beginning of the study period. Inequality in both groups increased over the 1990’s until the early-2000’s, at which point the groups started to diverge. Latin America, which has traditionally been the must unequal region in the world, suddenly bucked the global trend of increasing inequality and started to see sustained decreases in inequality, so much so that by 2014/15 it had about the same average income inequality as the OECD. This continental decrease in market income inequality is still the subject of ongoing analysis, but is likely due to a “winding down” of past inequality-increasing shocks, together with conducive macro-economic conditions and activist Government policies of social investment.
In addition to the group averages, Figure 1 also shows Venezuela and four other LatAm countries, Brazil, Mexico, Colombia and Uruguay. I wanted to include other countries to provide national context. I chose Brazil, Mexico, Colombia because these are the three most populous countries in the region (Venezuela is sixth). Colombia and Brazil are also neighbouring countries with Venezuela. Mexico is the northern-most country in the region. I chose Uruguay because it one of the Southern Cone countries.
Figure 1 shows that over the study period Venezuela always had lower income inequality than the LatAm-17 average. Indeed, it had the lowest average market inequality in the region, with Costa Rica (not shown) a close second. Venezuela had the same inequality trajectory as the regional trend, with inequality increasing in the 1990’s then stabilizing until the mid-2000’s, before decreasing until 2015.
Market income inequality is driven by a complex combination of trends and policies, both international and national. One of the reasons I am writing this blog is to understand what effect, if any, did the self-styled “Bolivarian Revolution” (“BR”) that began in 1999 with the administration of President Chavez that lasted until his death in March, 2013 (“BR-I”), have on Venezuela’s economic inequality? And how about under the administration of President Maduro for the three year period 2013-2015 (“BR-II)?
Looking only at Venezuela one concludes that both BR-I and BR-II lowered market income inequality in Venezuela. But that conclusion is unsatisfactory because it allocates all changes in inequality to national conditions and specifically to Government policies. A more nuanced analysis would try to differentiate between the international and national effects and allocate changes to each. There are a number of methodologies for such a task (including component analysis, etc.). In this blog I use a simple comparison-to-the-mean analysis.
For example, inequality increased during the 1990’s for LatAm-17 and OECD-14 and all countries in Figure 1 except Brazil. Regional inequality was going up but Brazil was bucking the trend; national developments were more than countering international trends. In this instance, I say that during the 1990’s Brazil was an “above-average” performer in reducing market income inequality. Further much more detailed analysis would be required to try to allocate this above-average performance between national trends and Government policies. Along these lines, I also say that since the mid-2000’s Mexico has been a “below-average” performer because inequality increased there while it was falling everywhere else in the region. All the rest of the countries (Venezuela, Colombia and Uruguay), however, are all “average” performers with upside-down “U” trajectories and lower inequality in the mid-2010’s than the early 1990’s. In this broader context, therefore, Venezuela’s inequality performance, including during the BR period, was average for the region.
Redistribution
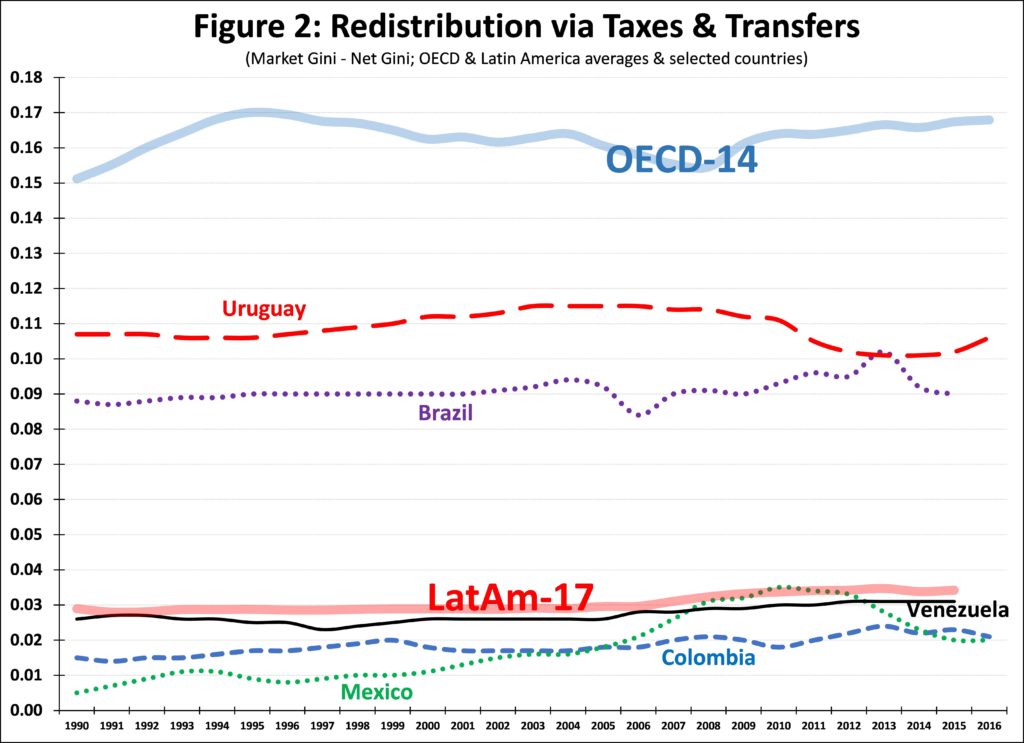
Disposable income is defined as market income after payment of direct taxes and receipt of Government cash benefits (e.g. unemployment, govt. pensions, social assistance, etc.). Disposable income does not cover “in kind” Government expenditures such as free education, free school lunches, subsidized housing, etc. Inequality of disposable income is measured by the “Net” Gini coefficient. The difference between the Market Gini and the Net Gini is referred to as “fiscal redistribution” or more generally “Redistribution” and reflects the extent to which Governments, either as a deliberate effort or as a consequence of other policies, reduce market income inequality by direct taxes and cash benefits.
Figure 2 shows that the OECD-14 has more than five times the amount of Redistribution as LatAm-17 (0.16 versus 0.03 Gini points). This difference reflects a number of political economy and administrative factors. That the amount of redistribution is pretty constant in all the countries shows how politically and, in Latin America, administratively challenging it is significantly change the amount of redistribution.
Uruguay and Brazil are all above the LatAm average, while Mexico and Colombia well below it. Venezuela’s redistribution, at about 0.03 Gini points, was relatively steady and slightly below the LatAm average. In this respect, Venezuela was a comparatively “average” performer. Nor did the level of redistribution increase during the BR, a surprising result given its reformist narrative. There are a number of possible explanations for this. One is that the SWIID Gini coefficients mis-measure redistribution for Venezuela. While SWIID does include standard errors, that of Venezuela (0.025 Gini points) is only slightly higher than that for the LatAm-17 average (0.021 Gini points).
A more likely reason is the level and composition taxes and expenditures in Venezuela were not conducive to high levels of redistribution. As many other large oil-producing states, Venezuela has traditionally had relatively low levels of taxation revenues, averaging around 15% of GDP over the 2010-2015 period. Oil royalties made up another 10% of GDP. In comparison, taxation revenues average about 25% for LatAm and 35% for the OECD. (All tax-related data from the OECD’s Revenue Statistics in Latin America and the Caribbean). Neither was the composition of taxation revenues in Venezuela progressive, with the large majority (10% of GDP) coming from value-added-tax (VAT). Thus personal and corporate income taxes (PIT, CIT) accounted for only 4% of GDP in Venezuela (compared to about 13% in the OECD). Given this relatively small CIT/PIT, it is likely that the taxes had no redistributed impact in Venezuela. Further, “disposable income” and the Net Gini coefficient are before the payment of indirect taxes such as a VAT (that requires a another level of granularity of data) and so therefore, “post-tax inequality” (that would include direct and indirect taxes) would be proportionally higher in Venezuela than in other LatAm countries because of its relatively high VAT.
The BR did not change this relatively regressive taxation composition in Venezuela. Indeed, Venezuela was one of the countries in the region that in the late 1980’s started to implement tax reforms that shifted the tax burden from the CIT/PIT to the VAT. In 1990 VAT only accounted for about one tenth of tax revenues, after which it grew steadily to about two-thirds by 2000. The BR maintained and increased this reliance on the VAT, did not increase PIT/CIT and did not implement any sizeable wealth or property tax.
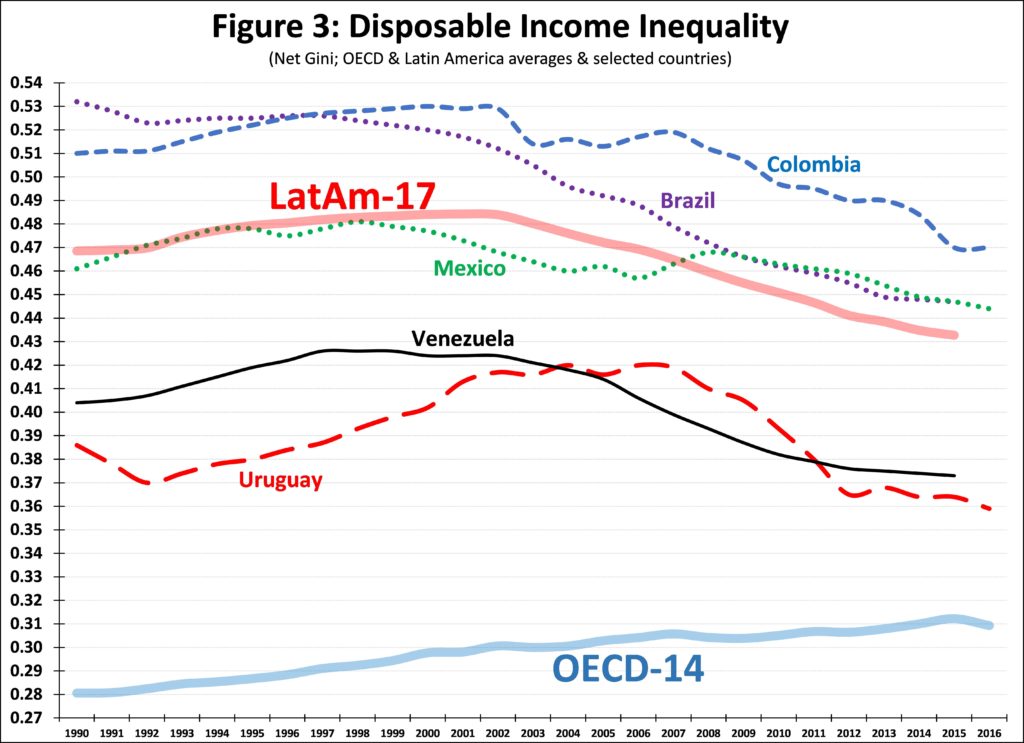
Net Income Inequality
Even though market inequality in the OECD and LatAm where similar in the mid-2010’s, Figure 3 shows how the larger redistribution in the OECD lowers net inequality well below that of LatAm over the same period. Figure 3 shows that over the study period Venezuela had 0.06 Gini points lower net inequality than the LatAm-17 average. Over that period it had the lowest average net inequality in the region, after Uruguay. However, from a comparative perspective, Venezuela was an “average” performer.
.
Social Spending
So from a comparative perspective I conclude that with respect to income inequality and redistribution Venezuela was an “average” performer in the region. This assessment includes the period of the BR adminstrations. But how about social spending?
Figure 4 shows Government social expenditures (education, health, housing, social assistance, etc., including in-kind and cash transfers) as a percent of GDP (figures from the UN’s Economic Commission for Latin America and the Caribbean (CEPAL for its acronym in Spanish) Social Investment Portal). Starting at the averages, LatAm countries spent about half that of OECD countries. Figure 4 shows Venezuela’s relatively large social spending relative to LatAm countries (tied for second place with Uruguay and Brazil, with Chile in first over the whole study period). We can see the BR in Figure 4, showing an uptick in 2001 for BR-I and then a very significant increase in 2013 and 2014 for BR-II.
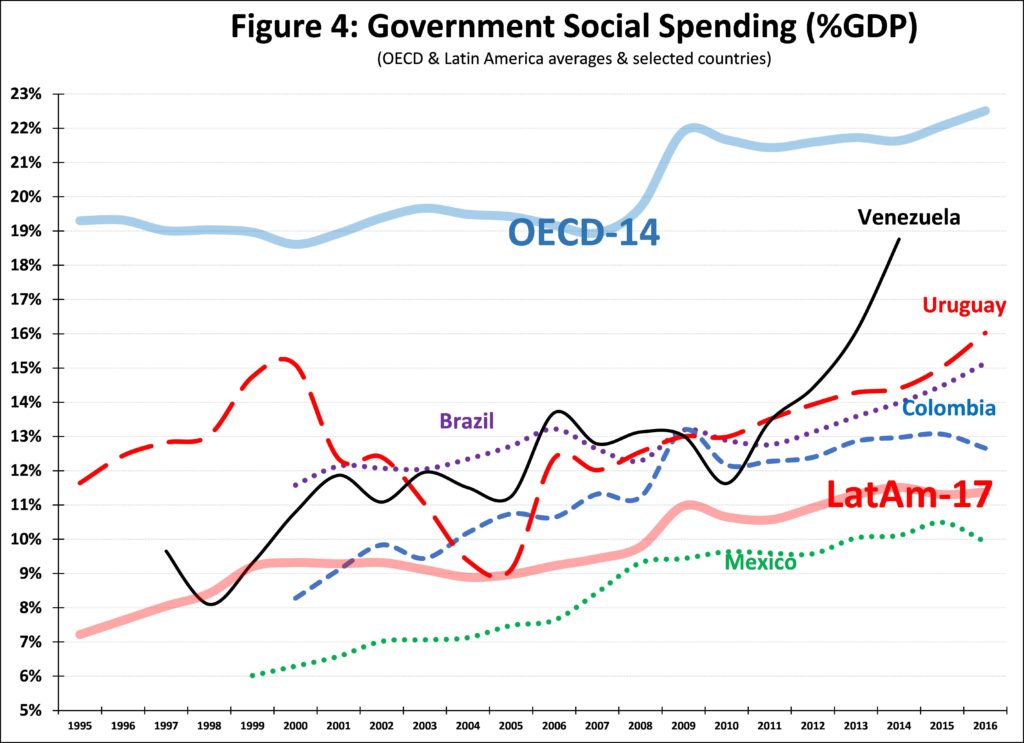
Comparing Figures 4 and 2 allows us to analyze the effectiveness of social expenditures in reducing income inequality. For example, Uruguay and Brazil’s relatively high social expenditures result in relatively high redistribution. In effect, the social spending/redistribution “multiplier” was about 0.8 for these two countries, meaning that they for each GDP percentage point of social spending resulted in an increase in redistribution of about 0.8 Gini points. In contrast to these “efficient” redistributive countries, Venezuela, Mexico and Colombia had multipliers of only 0.2. Means that a percentage point of GDP in social spending resulted in only 0.2 Gini points of redistribution. Such differential performance is likely due differences in the composition of spending (in-kind vs. cash transfers) or more likely the progressivity of that social spending. For political and/or administrative reasons Uruguay and Argentina are able to target their social cash benefits to the lower income households. The social spending/redistribution “multiplier” in Venezuela was relatively constant during BR-I but declined during BR-II.
Epilogue
The Venezuelan economy contracted moderately in 2014 and in 2015 before contracting by more than 10% each year over the 2016-2018 period and likely another 10% in 2019, resulting in a cumulative GDP decrease of over 50% since 2014. Venezuela would have dropped from having the second-highest GDP per capita in the region in 2014-2015, to the middle of the pack by 2018-2019. Venezuela’s relatively high inflation increased dramatically in 2016 and spiked into hyperinflation in 2017, which continues into early 2019.
There are a number of inequality-related issues in this economic crisis scenario. One relates to the relationship between inequality and economic growth and the other is how the crisis has affected inequality.
On the first point, it is first worth summarizing some of the new findings from the “Confronting Inequality” book published last month. One is that across time and across countries, lower income inequality tends to increase the duration of economic growth spells. The other is that redistribution (as defined here) tends to (slightly) increase economic growth, with the possible exception of very high redistribution. Venezuela was a low inequality country so the first finding suggests that statistically, inequality was not likely to have been a contributing factor to the current economic contraction. And the second finding leads to a similar statistical conclusion with respect to Venezuela’s low redistribution. There are other contributing factors to the current economic crisis in Venezuela.
On the second point, the impact on economic inequality of such severe macro-economic shocks is not well understood or easy to measure. Venezuela is this century’s first country that has endured hyperinflation (compared to perhaps 25 over the 1970-2000 period), so there is not much recent evidence on the subject. Earlier econometric analysis suggests that income inequality spikes during hyperinflation. Inequality also tends to increase during economic contractions. A reduced labour share, increasing unemployment, differential wage inflation-protection, insufficient indexing of cash benefits, differential access to USA-dollar denominated assets and remittances would appear to be some of the drivers of what is likely drastically increased income inequality right now in Venezuela.
Has anyone attempted to calculate inequality/GINI for Venezuela from 2016 on? Per capita income is way down from 2013. Poverty is way up from 2013. Some have estimated Poverty as high as 80%, which with a per capita income drop of about 50% since 2013, makes sense. Inequality?
https://www.imf.org/external/pubs/ft/weo/2018/01/weodata/weorept.aspx?pr.x=60&pr.y=8&sy=2013&ey=2019&scsm=1&ssd=1&sort=country&ds=.&br=1&c=299&s=NGDPRPPPPC&grp=0&a=
Hello Gringo:
I just noticed your question.
In response, no, I have not seen any new credible internationally-comparable data for inequality in Venezuela since my post in February. I just checked with the Standardized World Income Inequality Database (SWIID), and their most recent year for Venezuela is 2015, which is what I had used.
If you follow developments in Venezuela, you will be familiar with the challenges of accessing reliable and timely data. The relevant Government agencies have simply stopped collecting and/or publicly reporting data, since 2014 or 2015, at least. I suspect that this is a combination of administrative capacity and political information suppression / disinformation. This applies to everything from health, to education, to economic data.
There has been no official economic data for about four years either from the Central Bank (BCV) or the National Statistics Office (INE). This has allowed the Government to downplay the extent of the economic crisis. This strategy is having external consequences with the regional and global IFIs that Venezuela is a member of, which comes with rights and responsibilities. For example, last year the IMF issued a declaration of censure against Venezuela because it had not fulfilled its membership responsibilities related to periodic submission of economic data to the IMF.
As the economy worsens and the USA’s economic sanctions bite further, it is possible that the Maduro Government may have to request assistance from the IMF, so it would have an interest staying on-side of the IMF. Another issue that is playing out right now at the IFIs relates to recognition. As you know, Canada is one of about 50 countries that recognizes Guaido as the interim President, with the other 150 or so having affirmed or otherwise not changed their default recognition of Maduro as President. Guaido has now nominated representatives to the IMF, the World Bank and the Inter-American Development Bank (IADB). On March 15, the IADB Board voted to recognize Guaido’s appointment. Unlike UN voting, the IBD’s voting record does not appear to be public, but it is likely that Canada’s representative, Minister Monsef, voted for Guaido’s candidate. The IMF and World Bank are considering this matter, but the USA and Canada are likely to face some resistance in these global bodies, compared to within the Americas-region IADB.
The IADB’s annual meetings happened to be scheduled to be held in China in late March, but China denied a visa to the newly-appointed Venezuelan representative because China is one of the 150 or so countries that continues to recognize Maduro. The IADB will now meet in Ecuador in July.
In this context, most analysts were surprised on May 28 that the BCV unexpectedly released macro-economic data for the first time in about 4 years (up to 3rd quarter 2018). These confirm what I had included in the blog: looking at third quarter to third quarter changes real GDP shrank 7% in 2015, 19% in 2016, 16% in 2017, and 22% in 2018. That is a cumulative 51% decrease from third quarter 2014 to third quarter 2018.
While the release of the data could have been unauthorized, the more likely possibility is that it was authorized, but that begs the question of why now? The two most credible explanations I have read is that the Government may be establishing the bases for seeking IMF assistance or that, at the behest of China and/or Russia, it needed to show some cooperation with the IMF to help is allies counter its critics, led by the USA, in the internal IMF debate/discussions related to recognition of Venezuelan representation at the IMF. There have already been leaks that the IADB has been considering a very large assistance package after the change of representation, but that it has been presented as being conditional on a change in Government in Caracas. A similar dynamic would likely hold for any assistance from the IMF if the representation were to be switched from Maduro to Guaido.
This is critical because the fall in economic output has been very severe and has hit most sectors of the economy. Manufacturing was particularly hit hard, with a reduction of 75% since 2014. As you mention, this economic depression has resulted in very significant reductions in average per capita income, very significant human suffering, and increased out-migration.
To close on the inequality question, the INE has not published any Gini data since 2015. I looked at this data series in preparing the post, but preferred to use the SWIID data because it included Ginis for both disposable and market income. While the data were relatively similar, the SWIID data was closer to what the World Bank had reported in earlier periods. The Maduro Government issued its most recent 5-year plan (Plan Patria) earlier this year. One of the data points it included was a Gini estimate for 2018 of 0.377 which is patently unrepresentative of the current income inequality situation in Venezuela. The 5-year plan does not include the data reference for the estimate, and as I mentioned, it is not available on the INE website. The 0.377 number would be indicative of inequality remaining approximately stable over the past 4-5 years, which runs counter to the all the earlier econometric evidence of how inequality behaves during hyperinflation and severe economic contractions.
There are a number of explanations for this estimate. One is that the number is a true reflection of the application of the underlying methodology. Under this interpretation it would appear that the methodology is insufficiently flexible or broad to reflect the underlying economic reality in Venezuela, which means that administratively it should be revised. The other explanation is simpler – the Maduro Government invented the number to be able to continue its narrative of social solidarity and economic equality. I strongly lean towards this latter explanation of political disinformation.
Thank you.
(i) I did not quite understand why you state: “So from a comparative perspective I conclude that with respect to income inequality and redistribution Venezuela was an “average” performer in the region. ”
It seems at my glance to be less than average. But I may be missing something of course, how do you gauge that?
(ii) I would be interested in your take on the data that is presented by Statista: showing an increase in GINI between the years 2014 and 2022. (Via Acessed Statista 3 Sep 2024; via https://www.statista.com/statistics/1416810/gini-coefficient-venezuela/)
I am not sure how the data was collected but it seems plausible to me, and starts at about 0.4 in a comparable year as the ones you cite at the end of your time period.
(iii) Statista also has a plot of poverty and extreme poverty rates via: https://www.progressive-economics.ca/2019/02/income-inequality-and-redistribution-in-venezuela/
That would seem to be congruent to a rising inequity. Thoughts?
(iv) Finally – how would you get at chicken-or-egg – sanctions vs lack of movement by governments? I would be very interested in your thoughts.
Many thanks in advance for considering, Hari Kumar