
Debunking Fraser Institute’s latest contortion on taxes
The Fraser Institute’s annual Consumer Tax Index report generated some media buzz with its outlandish claims about just how much taxes have risen since 1961. Before you get worked up about this, consider that 1961 was over half a century ago, before the time of universal health care that we all benefit from, before the Canada Pension Plan and the Guaranteed Income Supplement that hugely reduced poverty for seniors, before the Canada Child Tax Benefit which is helping lower child poverty (though not enough!).There are big problems with the Fraser Institute report’s methodology which lead them to grossly overestimate the tax bill of the average Canadian family.
The Fraser Institute misleadingly includes all business taxes, import duties and resource royalties in the tax bill of the average family. The argument that the average Canadian family pays for all business taxes is simply not convincing for two reasons. First, even if individuals ultimately pay all business taxes, it’s not necessarily Canadians that pay them (think of all the stuff we export). Second, business tax is paid largely by shareholders and only a small portion accrues to workers. Recent research from the US pegs the split at 80/20. Given how unequally distributed shareholder profits and investment earnings are, taking an average of taxes paid by workers and shareholders is meaningless and grossly overestimates what average Canadian families pay.
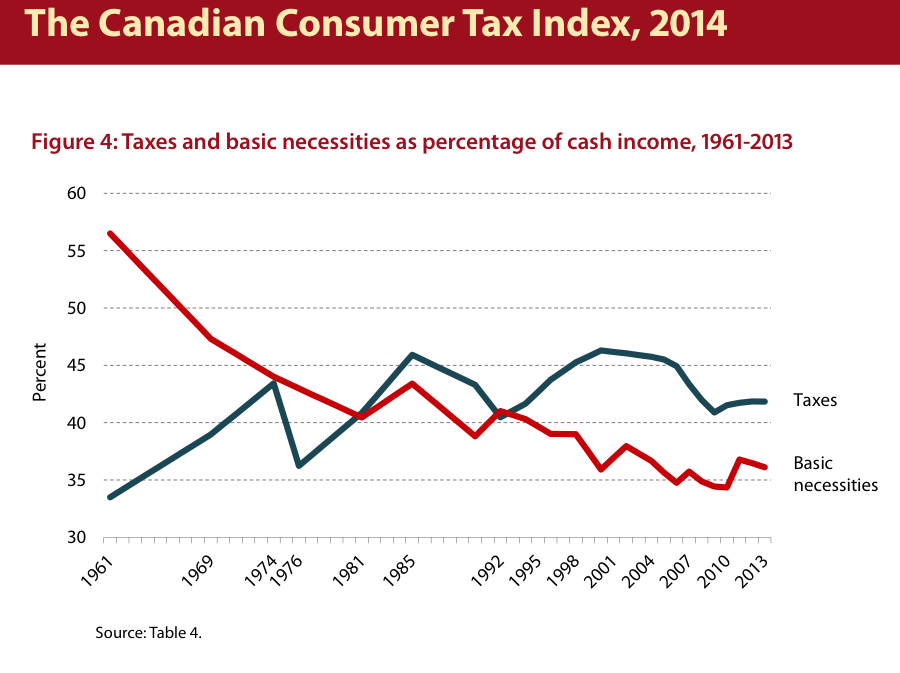
While the Fraser Institute report doesn’t tell us what a typical Canadian family actually pays in taxes, it gives a rough idea of trends in the total tax bill in Canada over the last 50 years. Business and personal taxes rose as a share of family income in the 1960s and then again between 1975 and 1985. But taxes have been cut significantly since 1999 (by about 5% of income) and are lower than they were in 30 years ago in the 1980s.
A more accurate measure of the total tax bill in Canada is the one used by the OECD, which compares total taxes collected with the size of the economy (as measured by GDP). The OECD numbers show very similar trends of increases in 1960s and 70s and significant decline since the late 1990s (about 5% of GDP). For reference, Canada’s GDP was $1.82 trillion in 2012 and 5% of that is $91 billion.
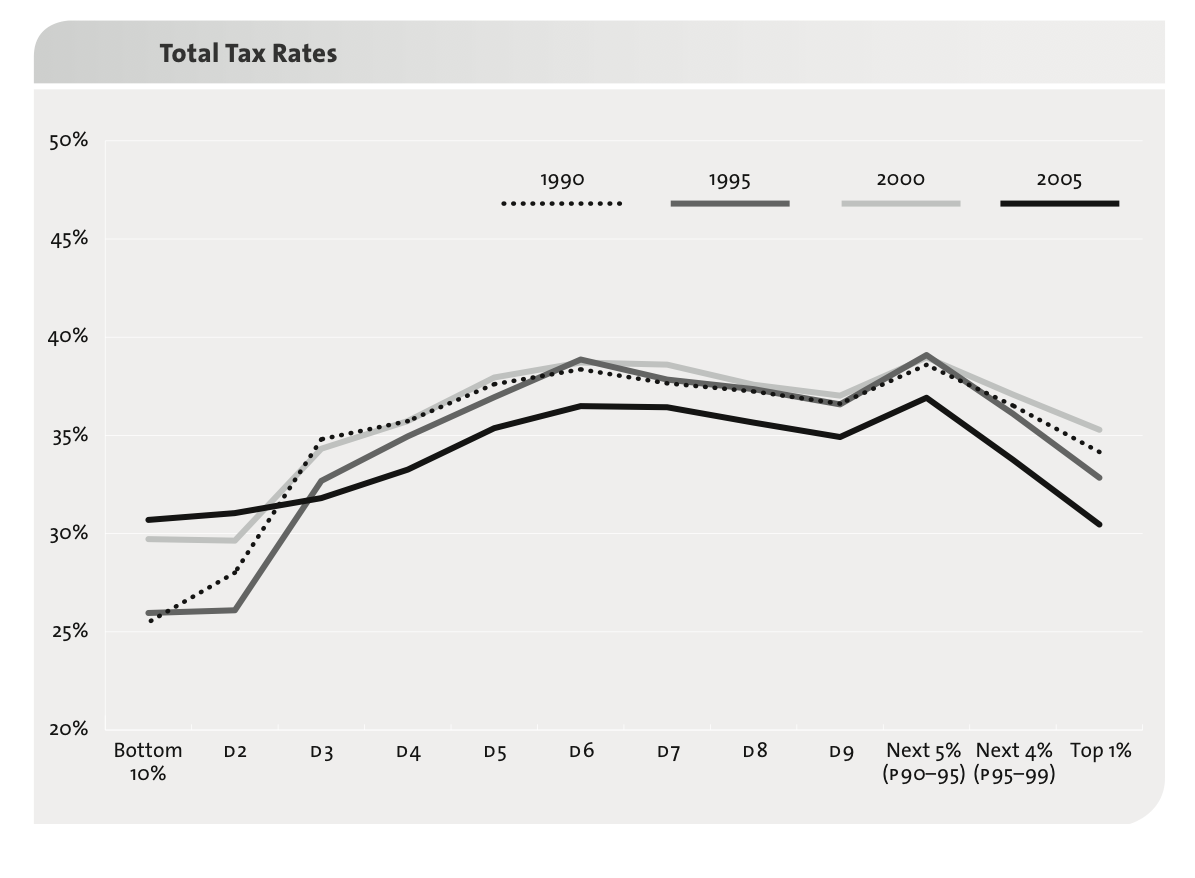
What neither of these charts tells us, however, is that the type of taxes Canadians pay have changed a lot, eroding the fairness of the system. Progressive taxes which ask higher income Canadians to pay higher rates (like the personal income tax) have shrunk as a share of the total tax bill while regressive taxes like the GST and other consumption taxes have gone up, taking up a higher share of incomes for lower-income households than from higher-income households.
A comprehensive analysis of all taxes that Canadian families actually pay by my colleague Marc Lee shows clearly the erosion of tax fairness that accompanied the tax cuts of the early 2000s.
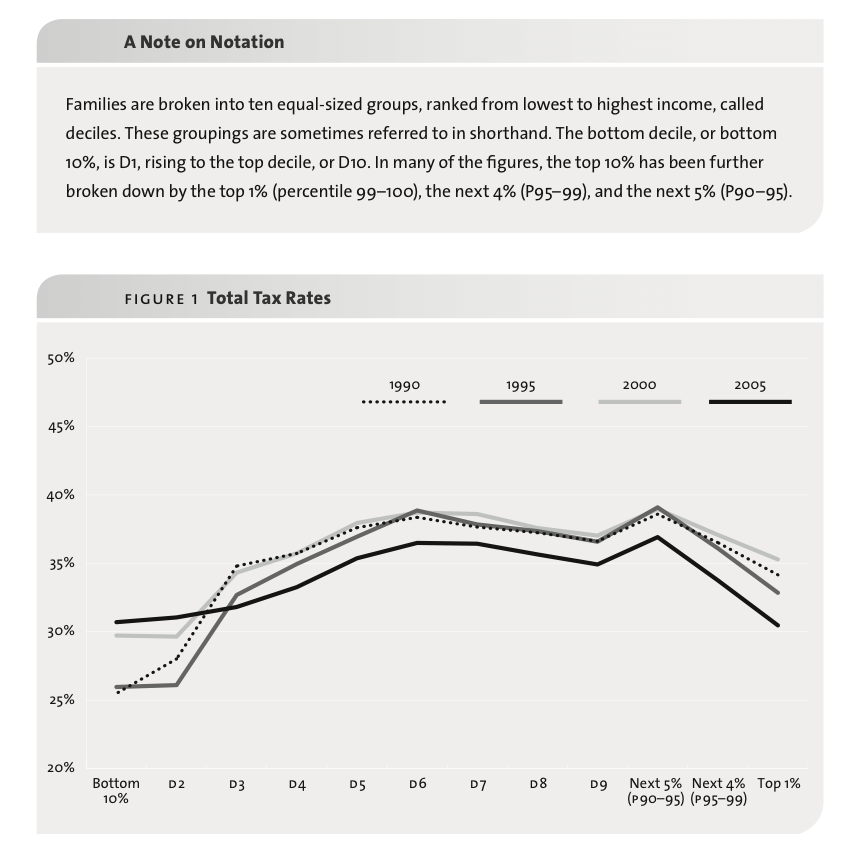
There has been two fundamental shifts in who pays taxes in Canada since the late 1990s:
- A shift of the tax bill from business to families (through large reductions of corporate income taxes and a proliferation of business subsidies and tax credits)
- A shift of the tax bill from higher income to middle and modest income families (through personal income tax cuts at the high end and an increased reliance on regressive taxes)
The tax cuts introduced since 2000, visible in both the Fraser Institute and the OECD data, have disproportionately benefited Canada’s richest families. Now that’s something worth getting worked up about.
—
Originally posted on PolicyNote.ca. Thanks to Trish Hennessy for the title idea.
This is by no means the first time the annual Fraser Institute Consumer Tax Index has been debunked. Here are some previous critiques I’m aware of. Please post links to others in the Comments so I can update the list!
By yours truly: in 2013 here, in 2010 here, here and here
By the Broadbent Institute: here
By Erin Weir: here
This is great stuff, thanks as always. But what bothers me is that you’re preaching to the choir. Fraser submits op eds to the newspapers that get read by 100,000 people; a blog like this gets read by maybe a few hundred. A lot of laymen like me would like to read real analysis in the newspaper rather than Fraser’s garbage, but most of us don’t even know PEF (eg) exists. Do you (and others) try to get stuff like this printed and get rejected? If so, tell the people reading this blog about that too. But if you’re not sending stuff in, do it!
The preaching does look as if it’s aimed at the choir, as is not unusual here, being weigted with such a ridiculous degree of bias that it quickly falls over on its side. At least one of your readers is not in that target audience. By all evidence presented here, the claim that taxes are lower than they were in the 1980’s is substantially farther from the truth than the claim that they’re higher than they were in the 60’s. The tendency to make all unreasonable efforts to believe whatever aligns with the writer’s prejudices pervades the whole thing.
I haven’t read the Fraser Institute thing (the lack of a link to it here is a telling omission), because I assume it is filled with the same kind of bias in the opposite direction. If you want to convince people who are skeptical of your positions, perhaps try more of the attitude of a scientist open to the truth and willing to question everything, rather than a preacher who already knows all the answers.
In response to Steve, I just want to share some mainstream coverage that builds on Iglika’s critiques of this FI report over the years. Here: http://globalnews.ca/news/1506408/reality-check-canadian-family-tax-spending-1961-versus-today/ and here: http://www.thestar.com/opinion/commentary/2014/08/14/fraser_report_conceals_big_picture_on_taxes.html
For Shan, the whole Fraser Institute thing is at http://www.fraserinstitute.org/uploadedFiles/fraser-ca/Content/research-news/research/publications/canadian-consumer-tax-index-2014.pdf. Note that chart of said index is accurately included in the article above and that the contention that taxes were higher in the 80s is from that chart and is not a contention of the author here. Nor does the author contend that taxes were not higher in 1961. Just saying.
@Steve: Thanks for the feedback. FYI, blog posts often get picked up by mainstream media and end up generating media coverage either by being quoted in articles or by leading to interview requests.
This particular blog post (from the PolicyNote blog) was quoted by the Globe and Mail’s business columnist Mike Babad in his coverage of the Fraser Institute report: http://www.theglobeandmail.com/report-on-business/top-business-stories/sandwich-canadians-far-short-of-money-for-ideal-retirement-bmo/article19999873/
I also did a number of media interviews when the report came out last Tuesday, as Angella pointed out, including
– CBC Calgary live radio interview with Doug Dirks
– CBC news http://www.cbc.ca/news/business/canadians-spend-more-on-taxes-than-food-shelter-fraser-institute-1.2734146
– News 1130
I was this close to being interviewed by Global News (national) but they told me they were unable to send a camera to me in Vancouver and my Ottawa/Toronto colleagues were all on holidays on the day the report came out.
At CCPA-BC, we regularly submit op-eds about our own research to newspapers and they are usually printed. In terms of debunking other groups’ research reports, the newspapers tend to be a little less interested in those but you are right to suggest that we should still submit them.
@Shan: The title of this blog post is deliberately inflammatory, but the original blog post on PolicyNote.ca was titled “How have taxes changed over the last half century” which I think you’d agree displays “more of the attitude of a scientist open to the truth and willing to question everything”.
Here is the thing: many (if not most) of the Fraser Institute are simply annual updates using a methodology developed years ago. Often, the methodology is not even fully outlined in the report and you have to dig back to old reports to find out what they are actually including in the calculations (which I do). The first time one comes across the report, it’s reasonable to approach it with an open mind, take it at face value as an honest effort to quantify something and analyze it, the second time one comes across it, one can approach it with an open mind. For me this is year 4 (as you’ll see at the bottom of the blog post, my first open minded, neutral critiques were posted in 2010). I’m starting to feel like a broken record raising the same methodological flaws year after year, as if this has never been an issue before. How do you suggest approaching this next year, when they will undoubtedly release a report using the very same methodology again?
@Shan: You’re incorrect in claiming that “By all evidence presented here, the claim that taxes are lower than they were in the 1980′s is substantially farther from the truth than the claim that they’re higher than they were in the 60′s.”
Comparisons of tax levels in absolute terms (in dollars) over periods of 50 years of even 30 years are meaningless even after adjusting for consumer price inflation (which the Fraser Institute report’s headline number does not do). A more meaningful comparison is to look at effective tax rates or taxes relative to our ability to pay which is to say our incomes (at the family level) or GDP (at the country level).
I present two pieces of evidence that support the claim that taxes are lower today than they were in the 1980s.
1. A chart from the Fraser Institute report showing average taxes per household as a share of household income (by their calculations). The chart shows taxes as 42% of income in 2013 and over 45% in 1985, which is clearly lower. Also shown is that taxes exceeded 42% of income in all years 1982 – 2007 except for a short dip in what looks like 1992. There’s no doubting this is a decline.
2. Data from the OECD which looks at total tax revenues in Canada (incl. all the natural resource royalties and business taxes) as a proportion of GDP. Note that this does not represent the tax bill for families, it represents the tax bill at the national level for families and businesses together. This also shows a pattern of decline since the late 1990s. It also shows that today, taxes as a share of GDP are lower than they’ve ever been since the early 1980s.
Note also that the majority of social programs Canada has introduced since 1961 – universal health care coverage, CPP, OAS/GIS, and building new universities – happened between 1961 and the early 1980s. This is why it’s particularly meaningless to compare tax levels in 1961 to tax levels in 2013 without mentioning the programs these taxes are funding, while comparisons since the early 1980s are slightly more reasonable (though still need to be examined in the context of services provided).
There HAVE been two. Lord people. Go back to school